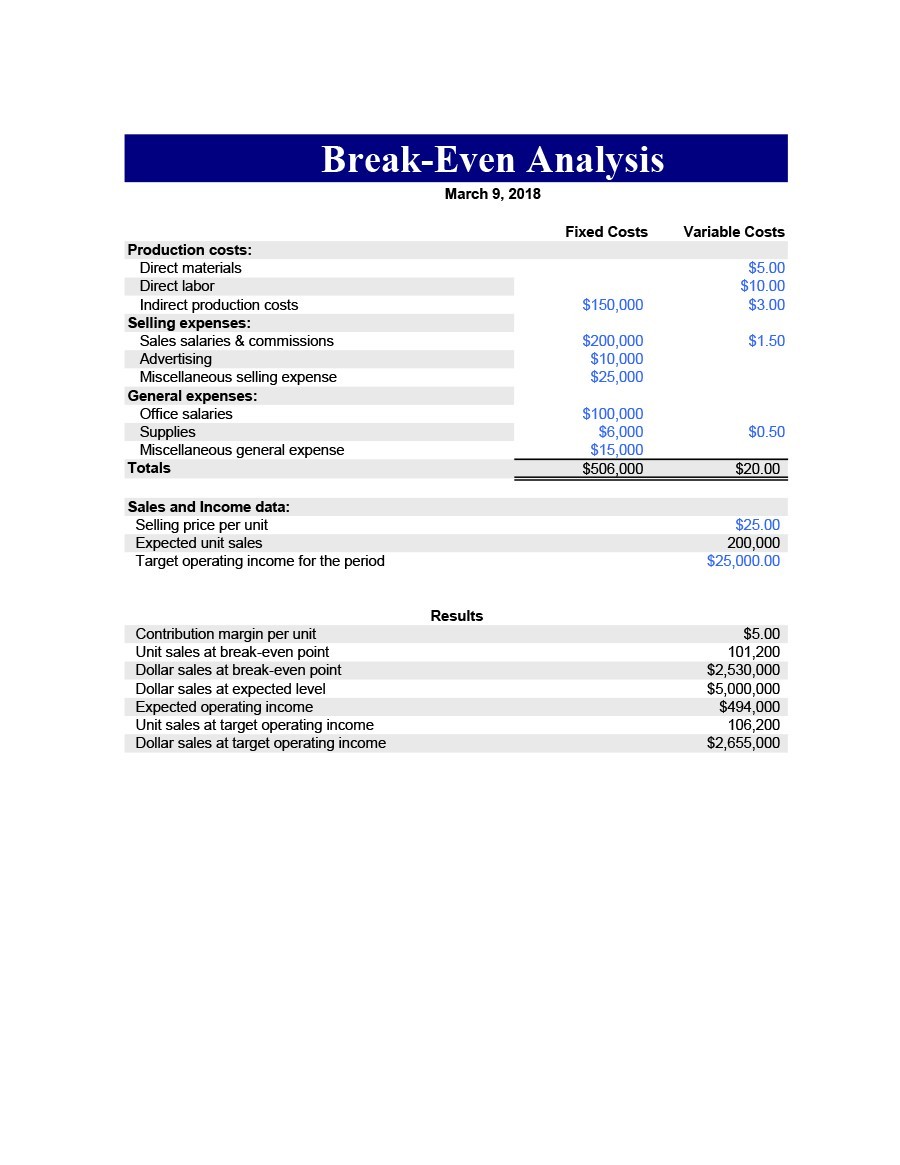
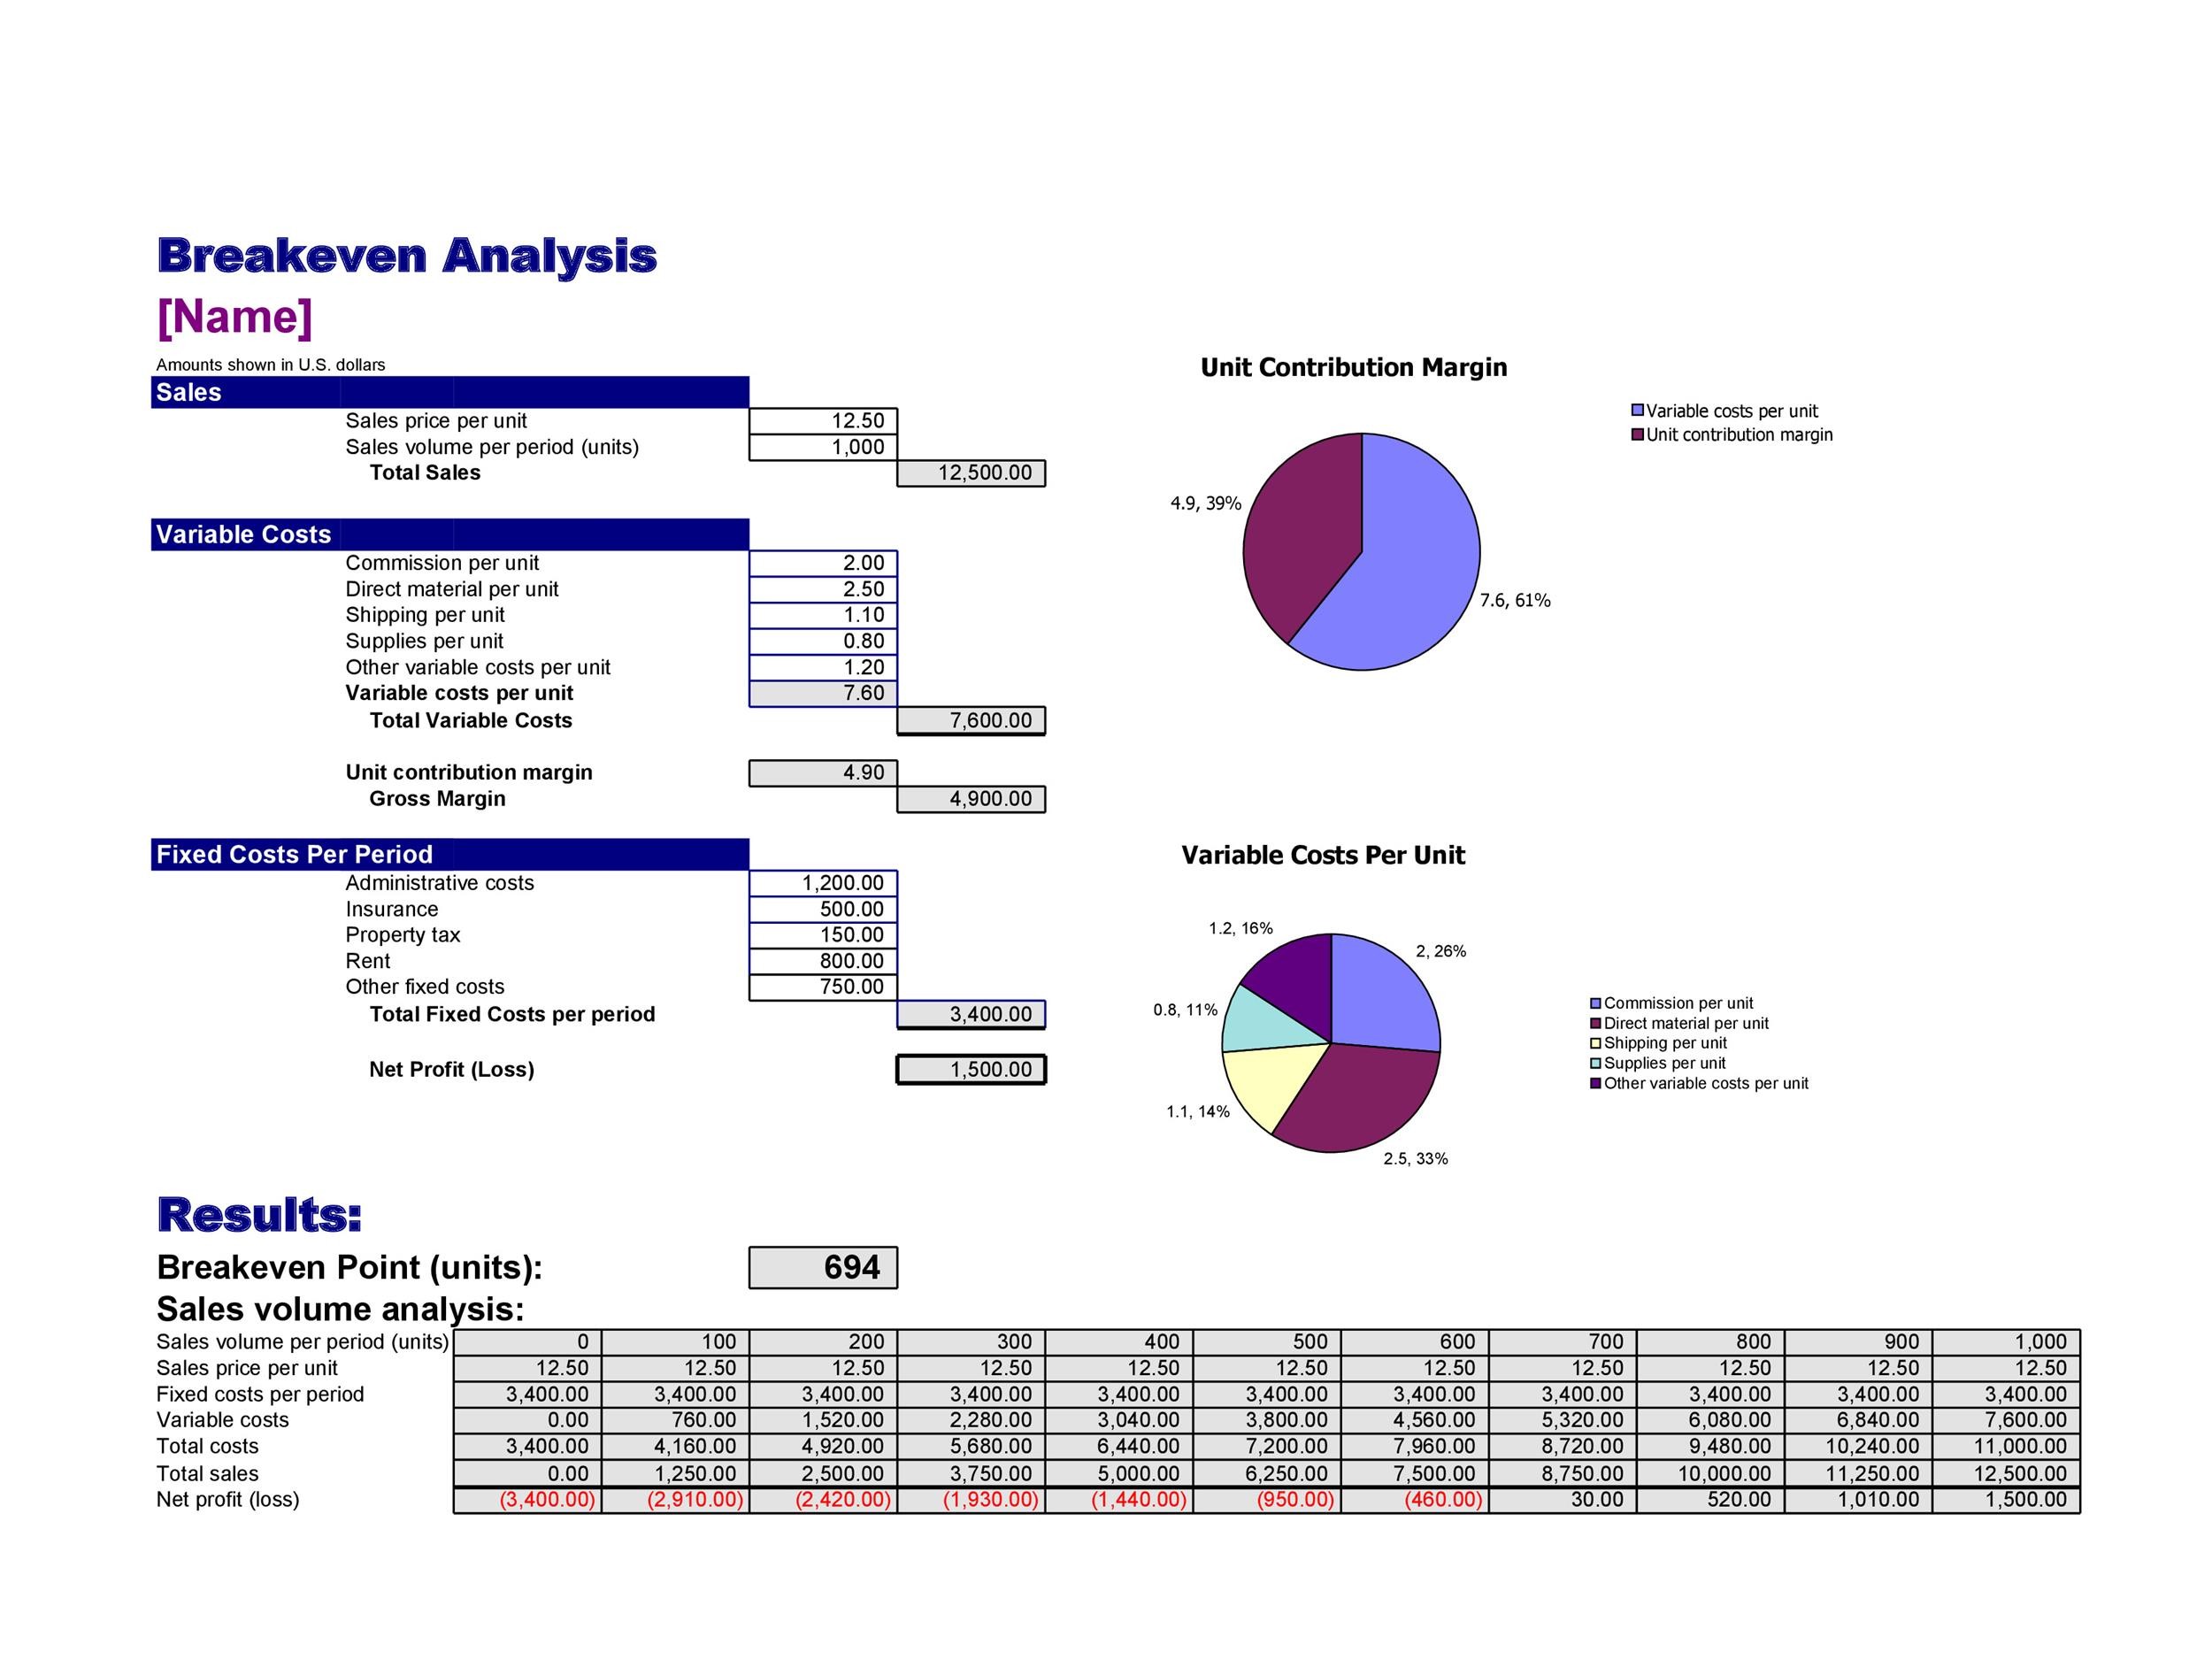
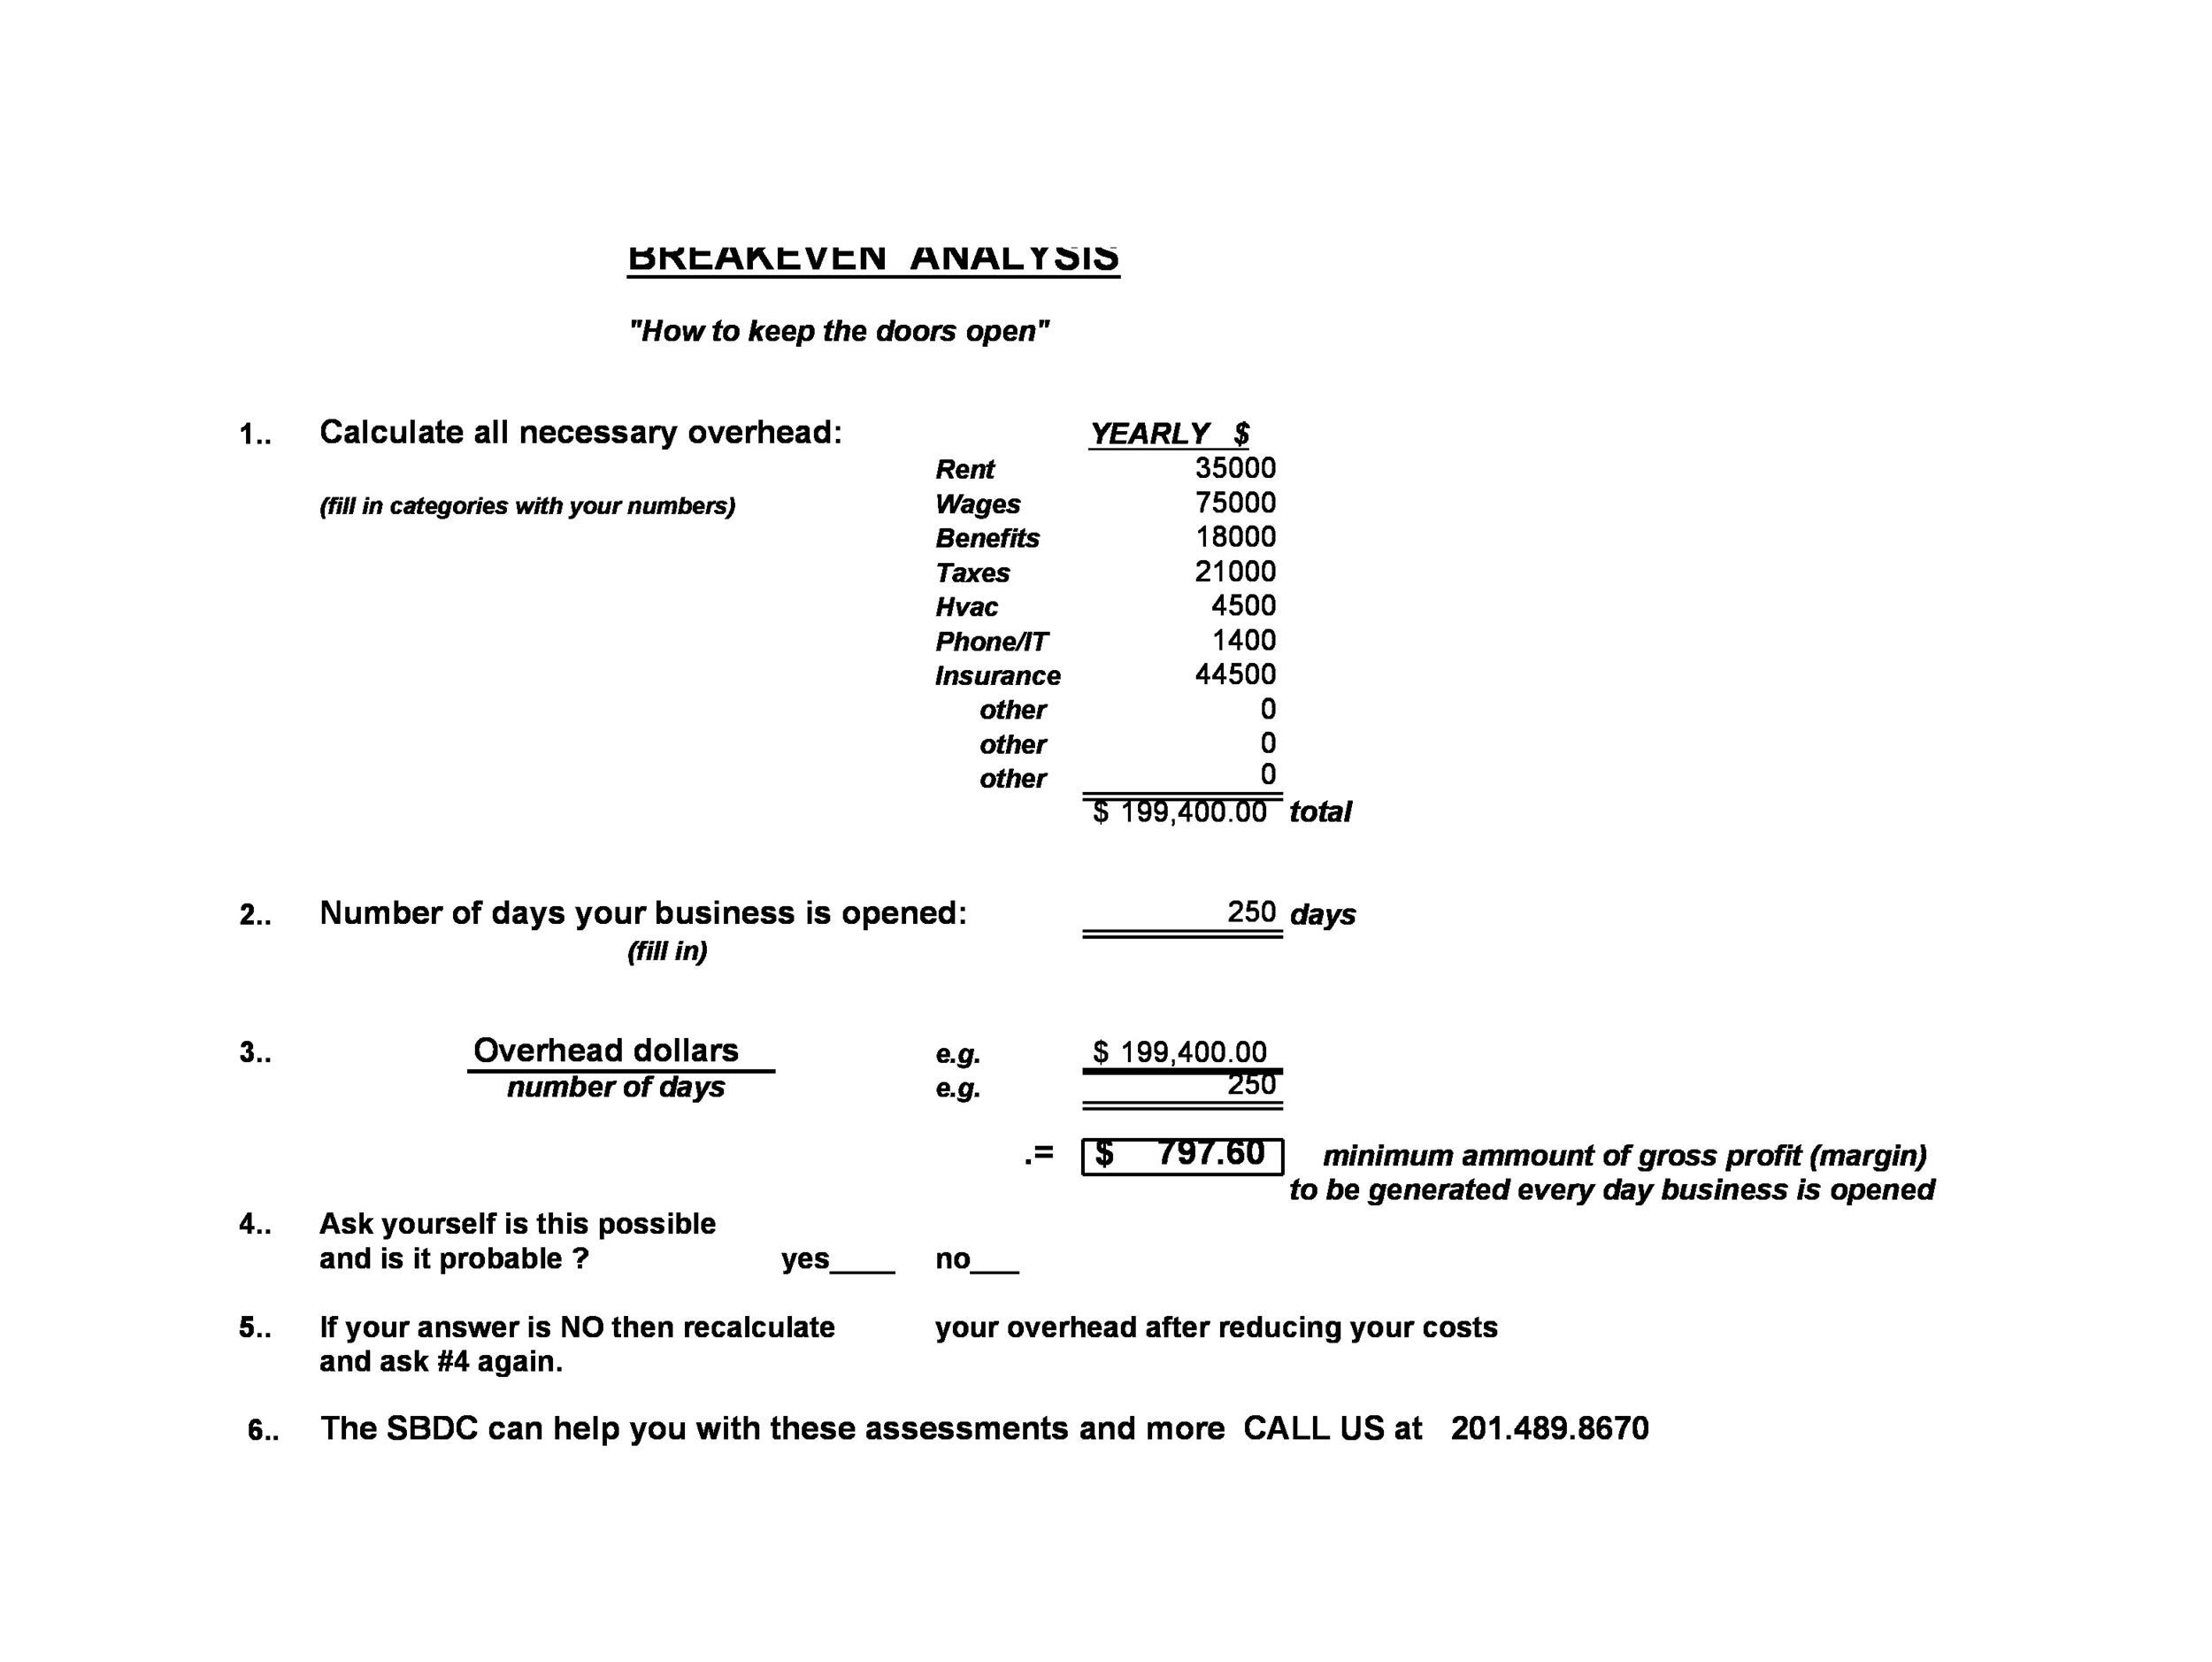
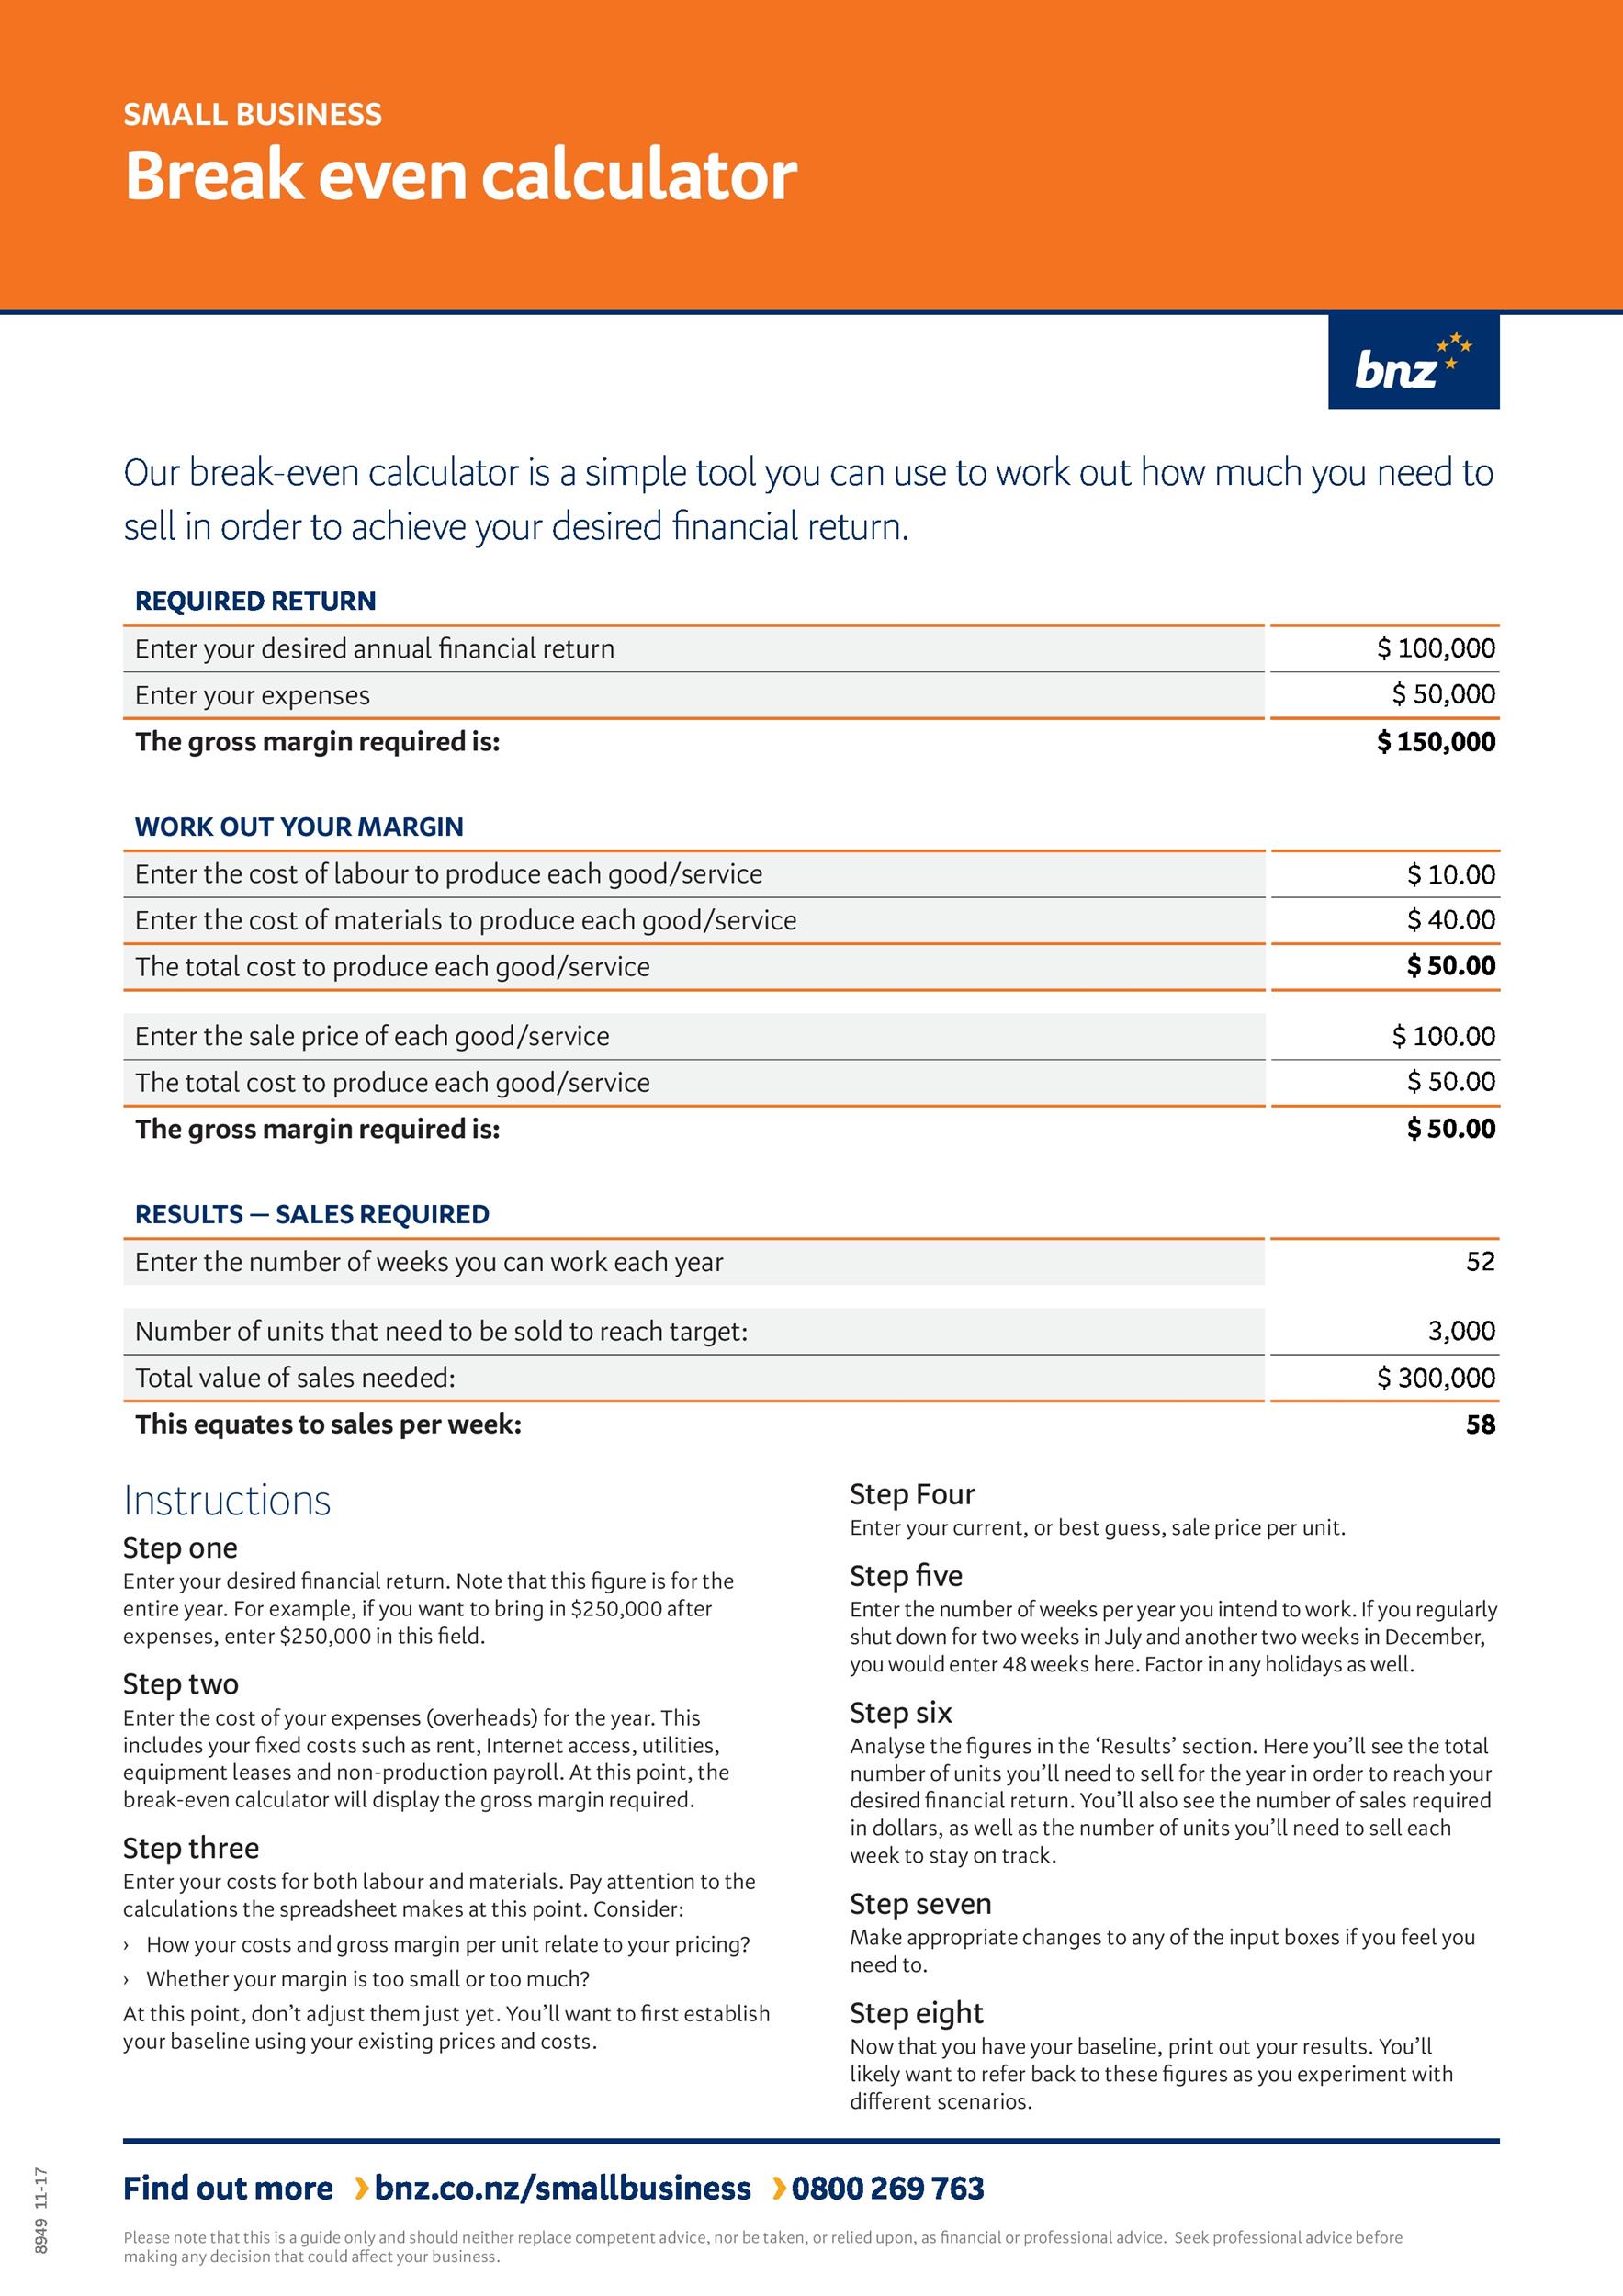
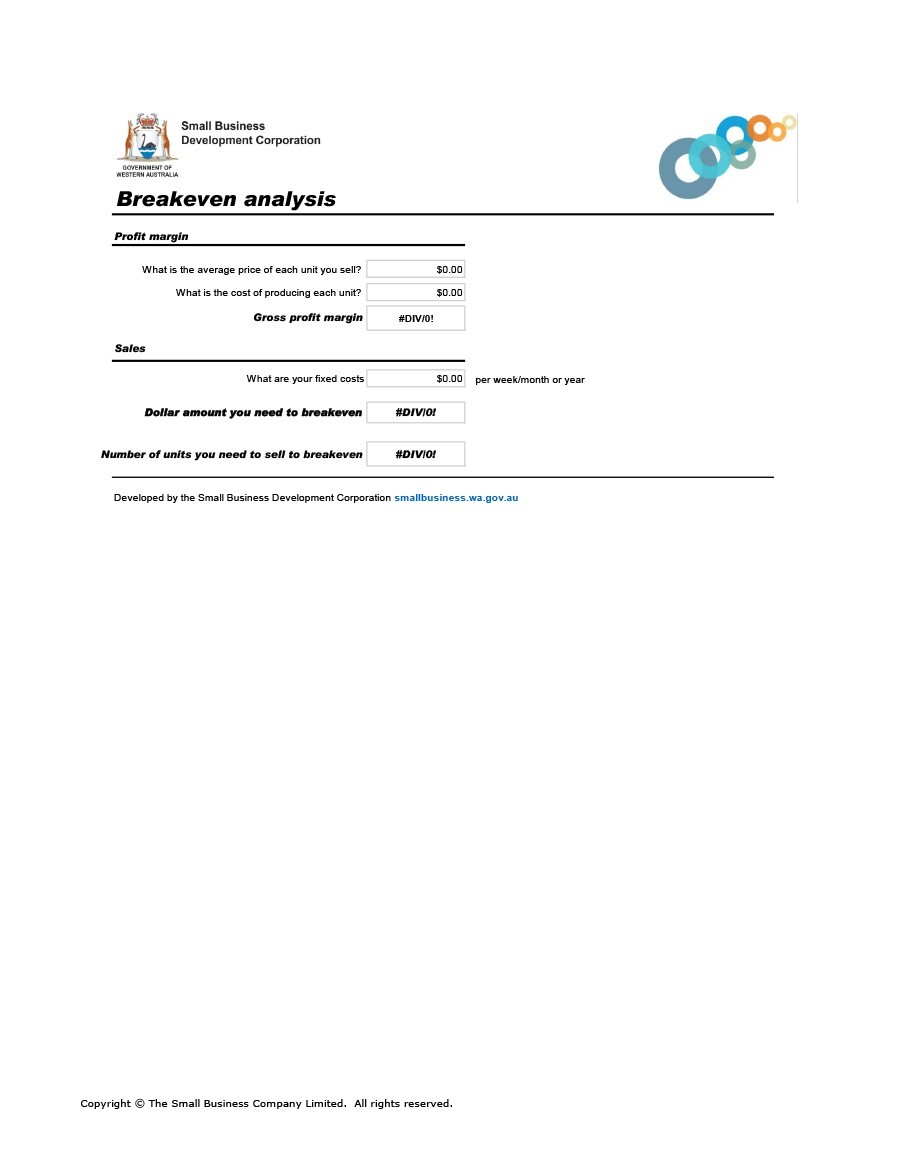
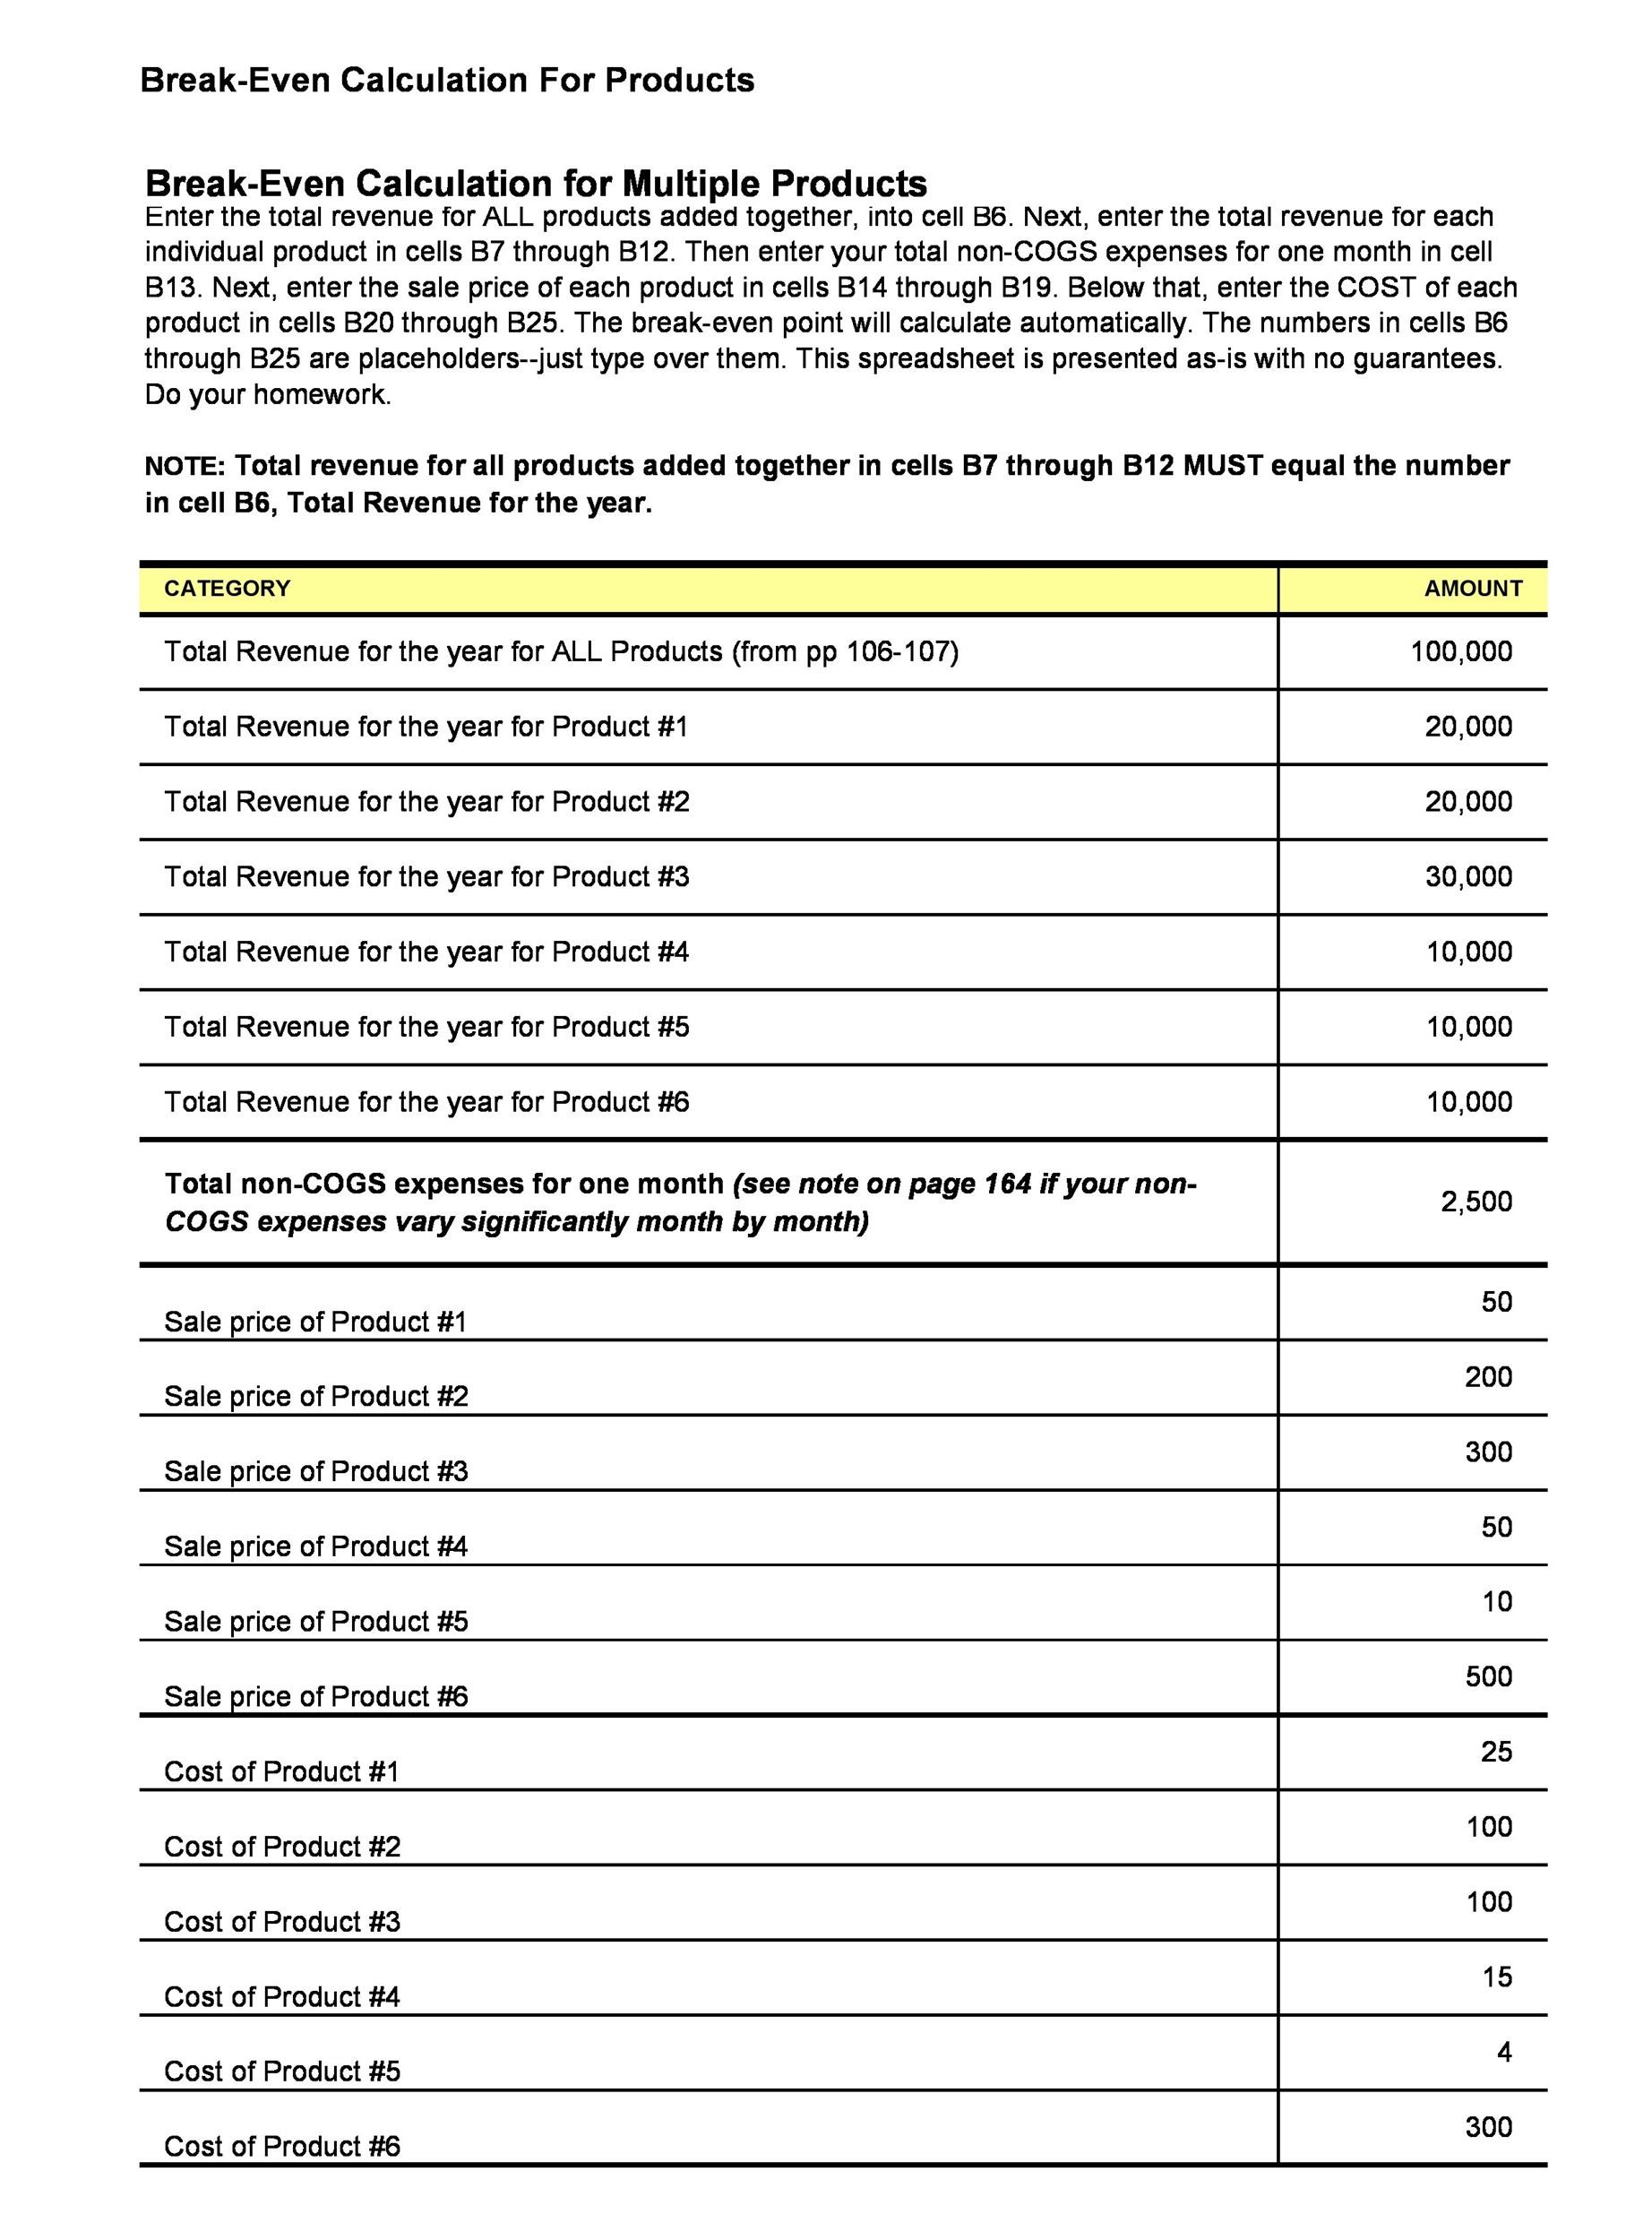
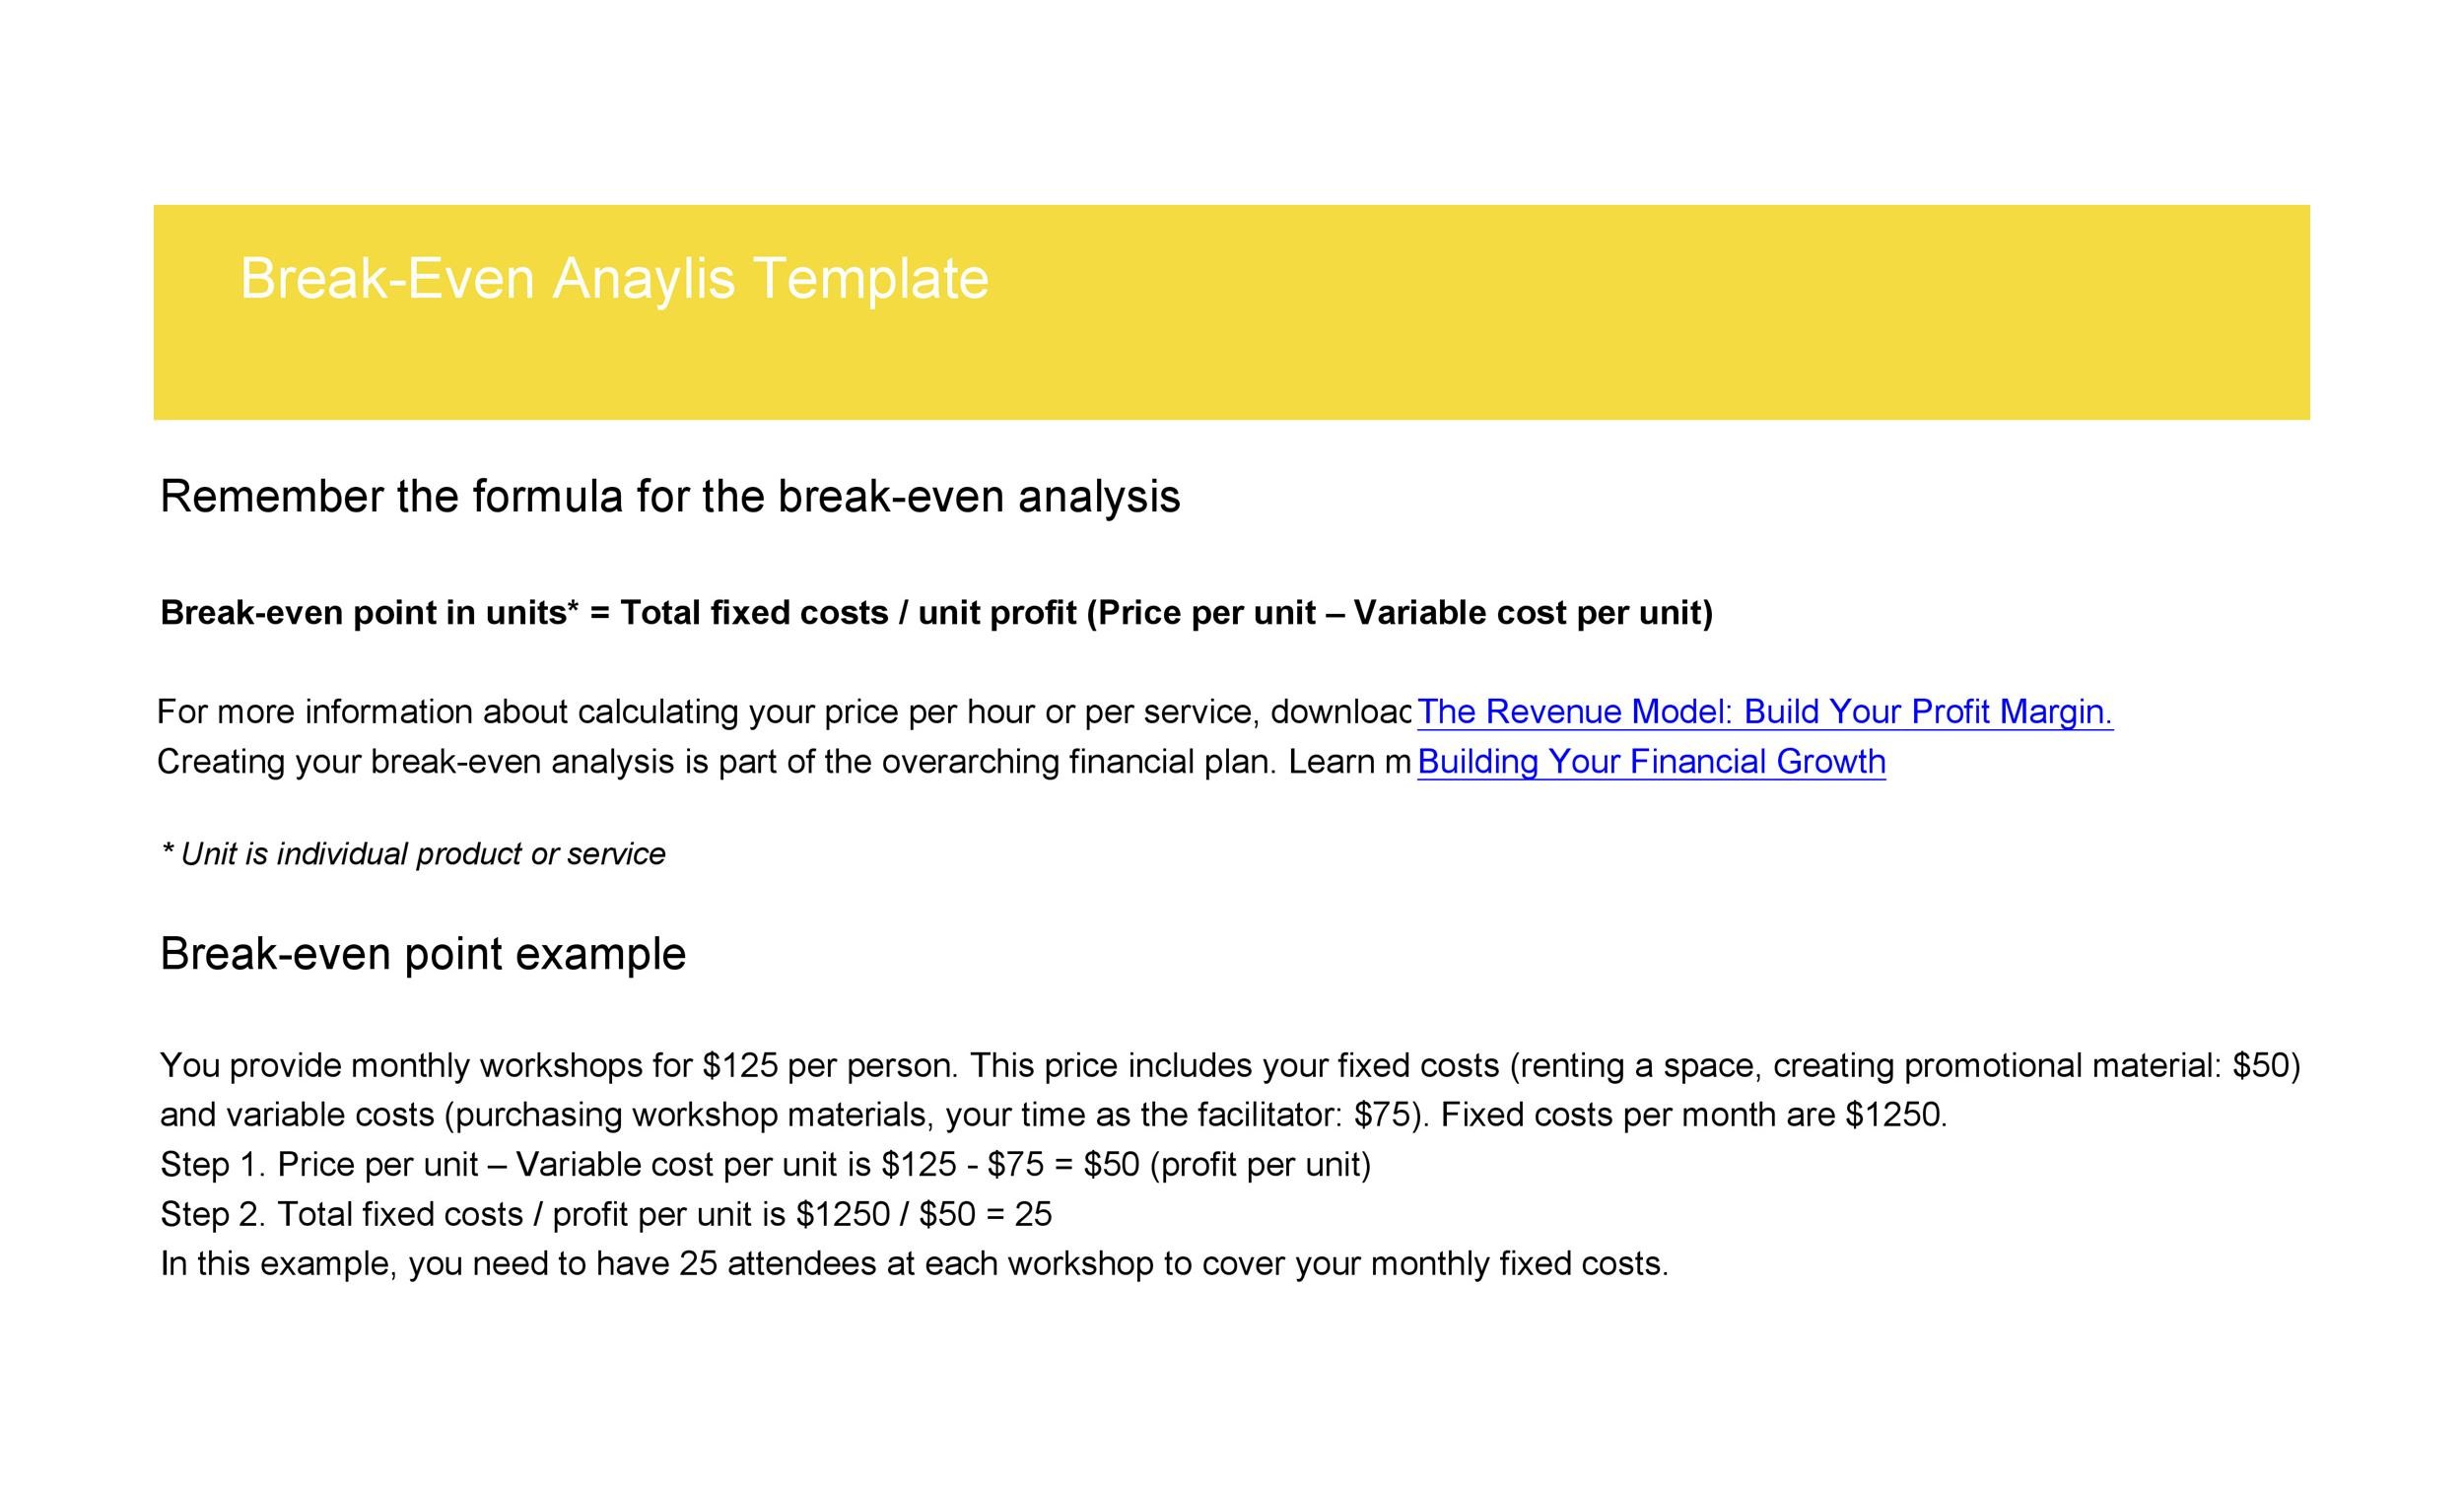
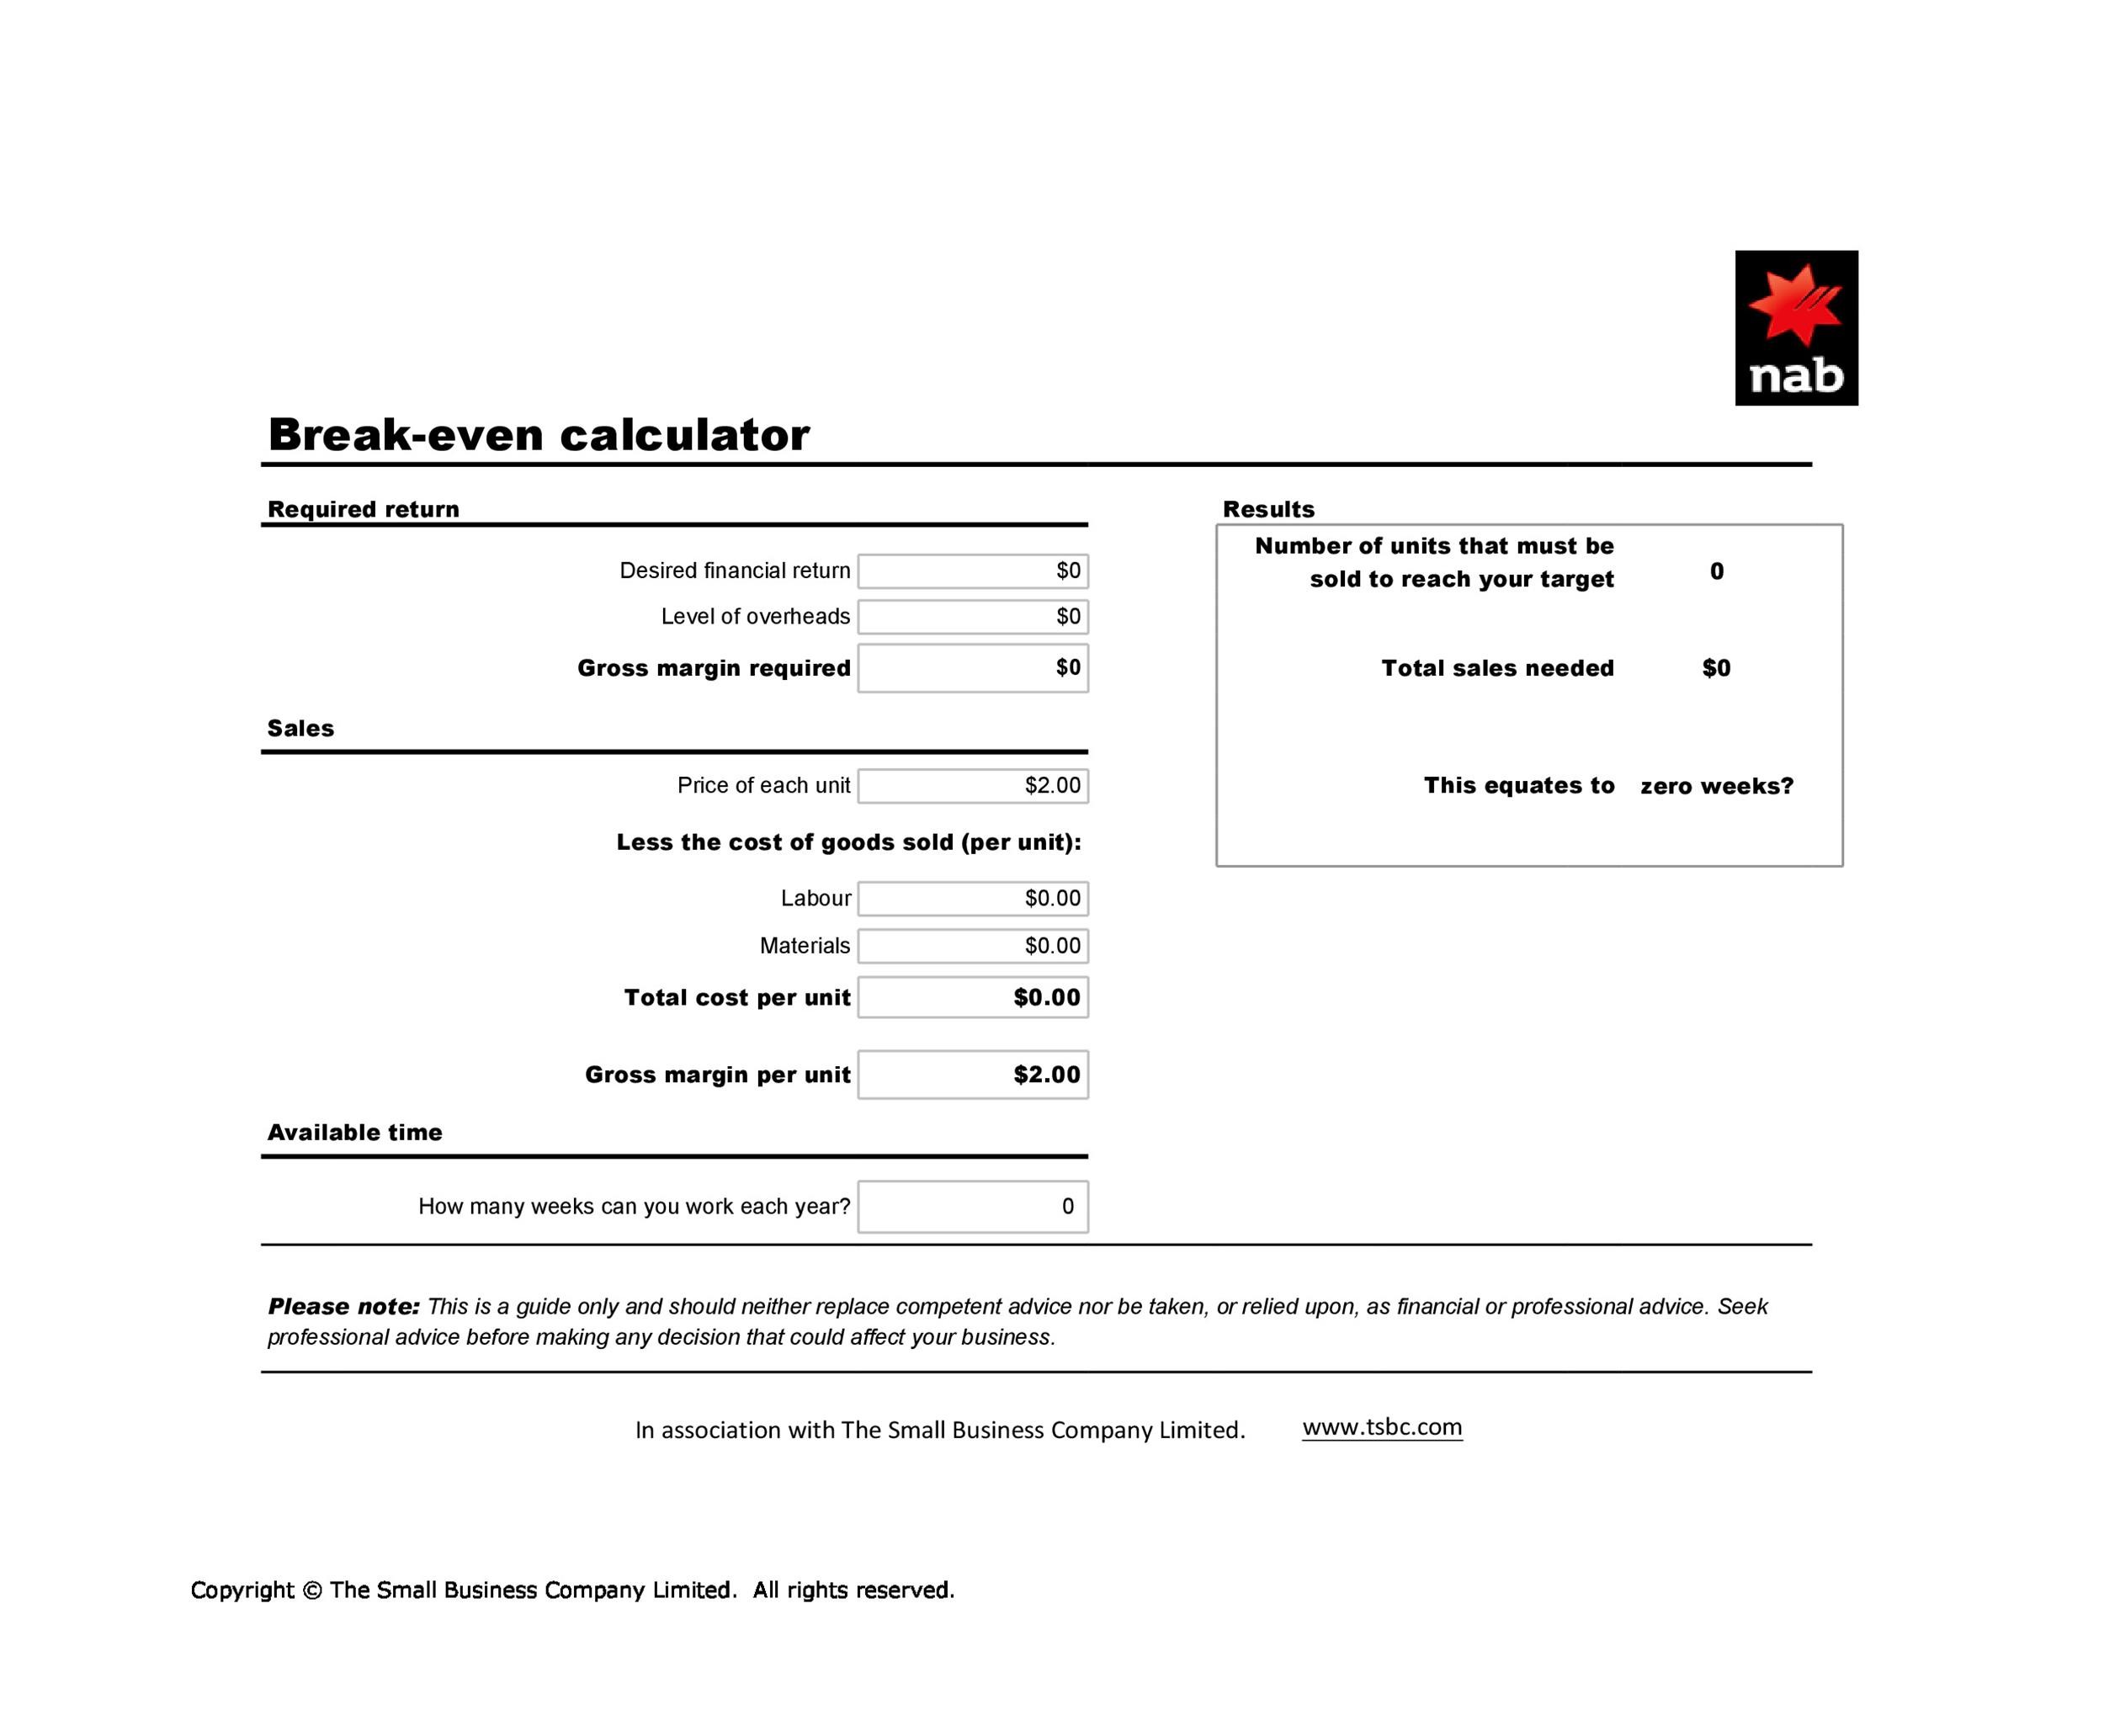
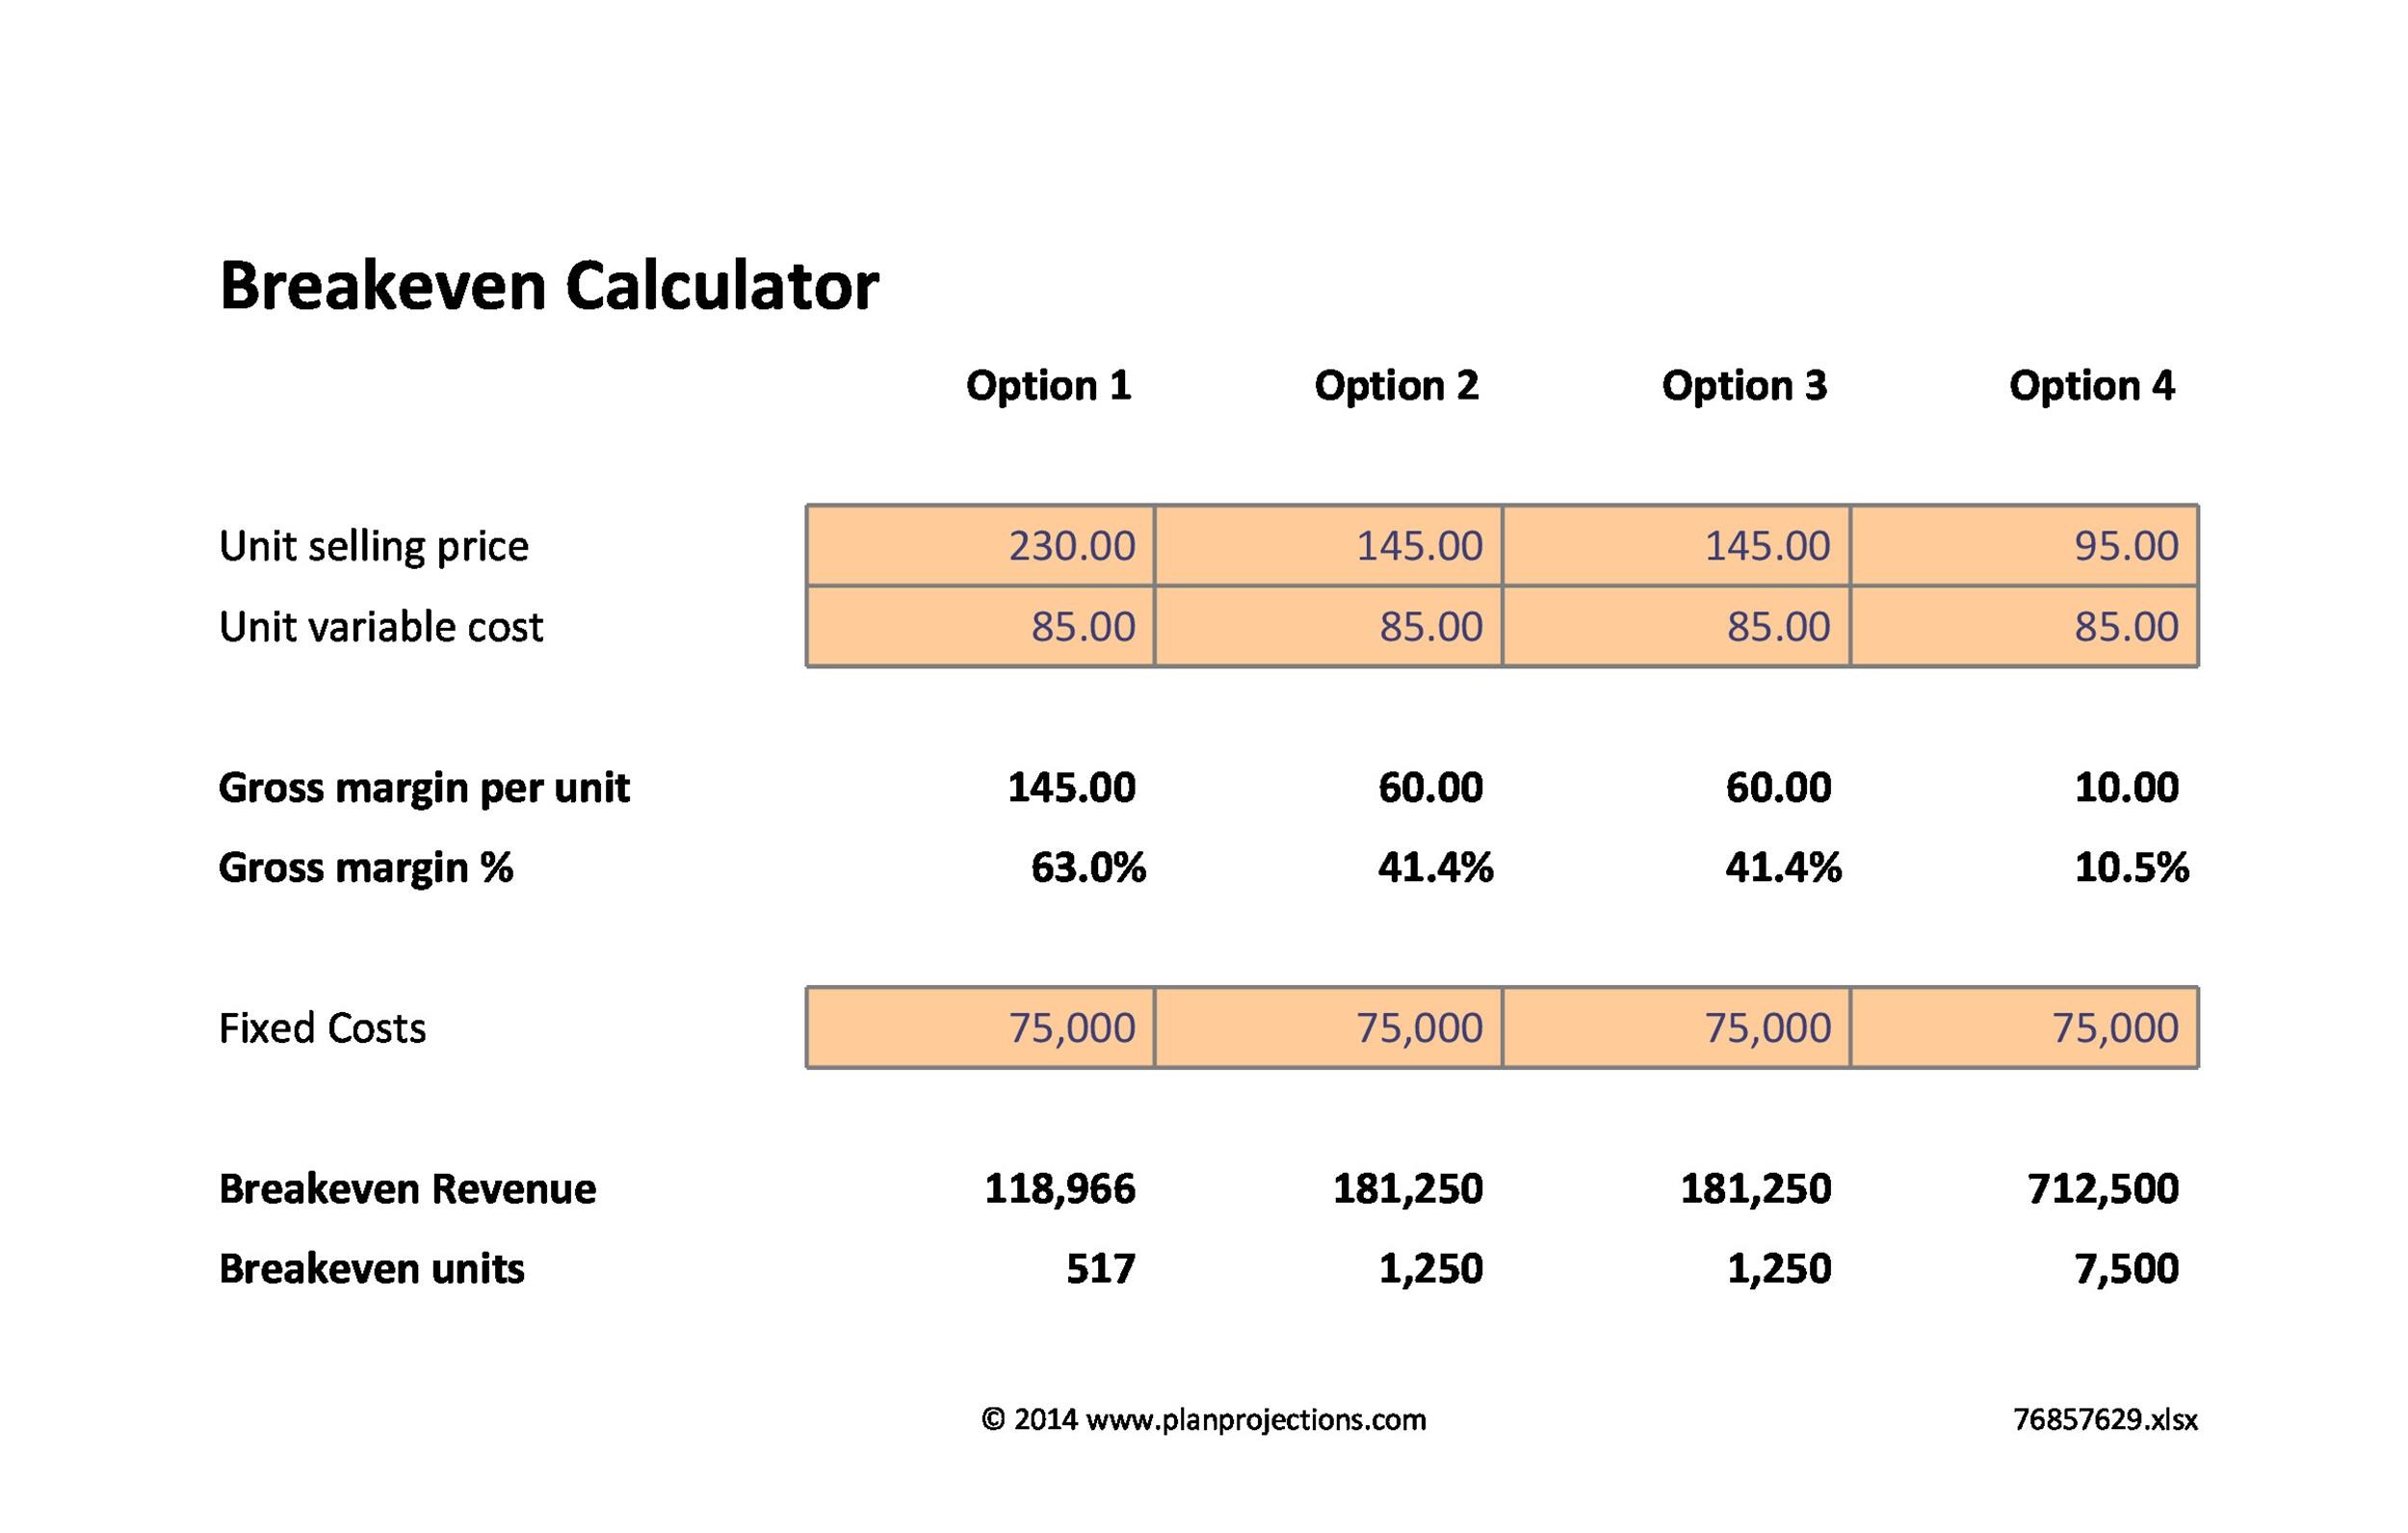
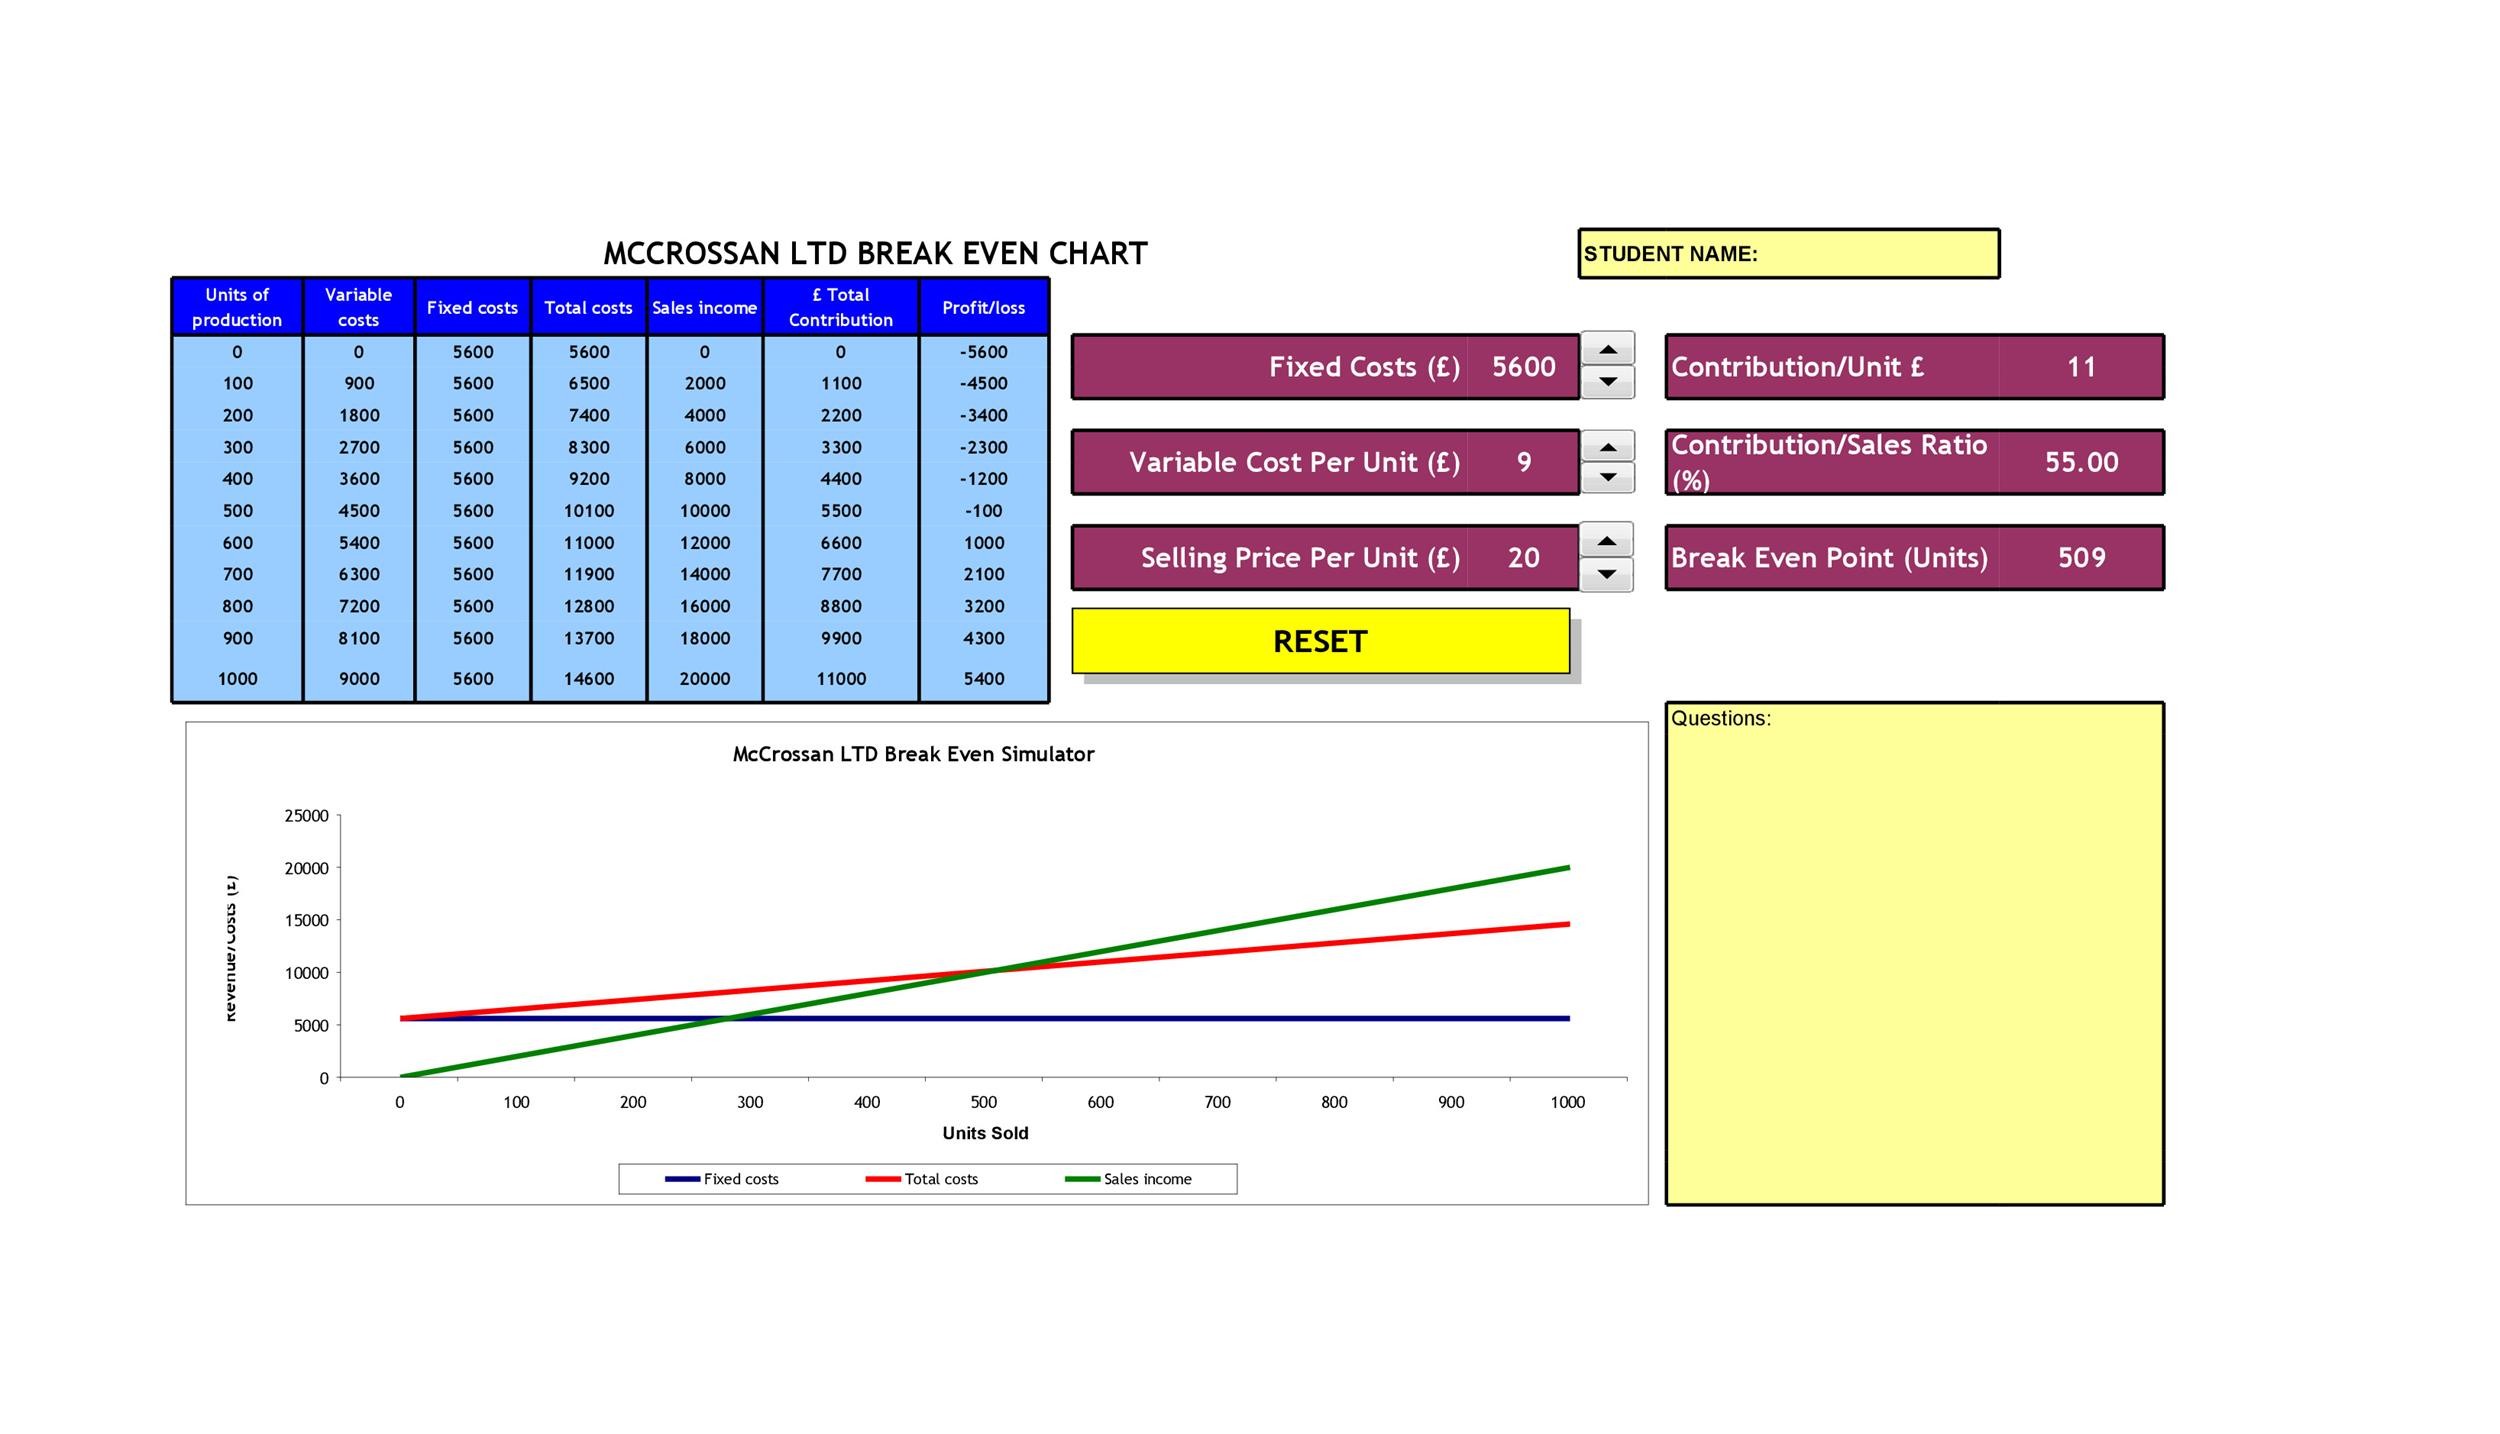
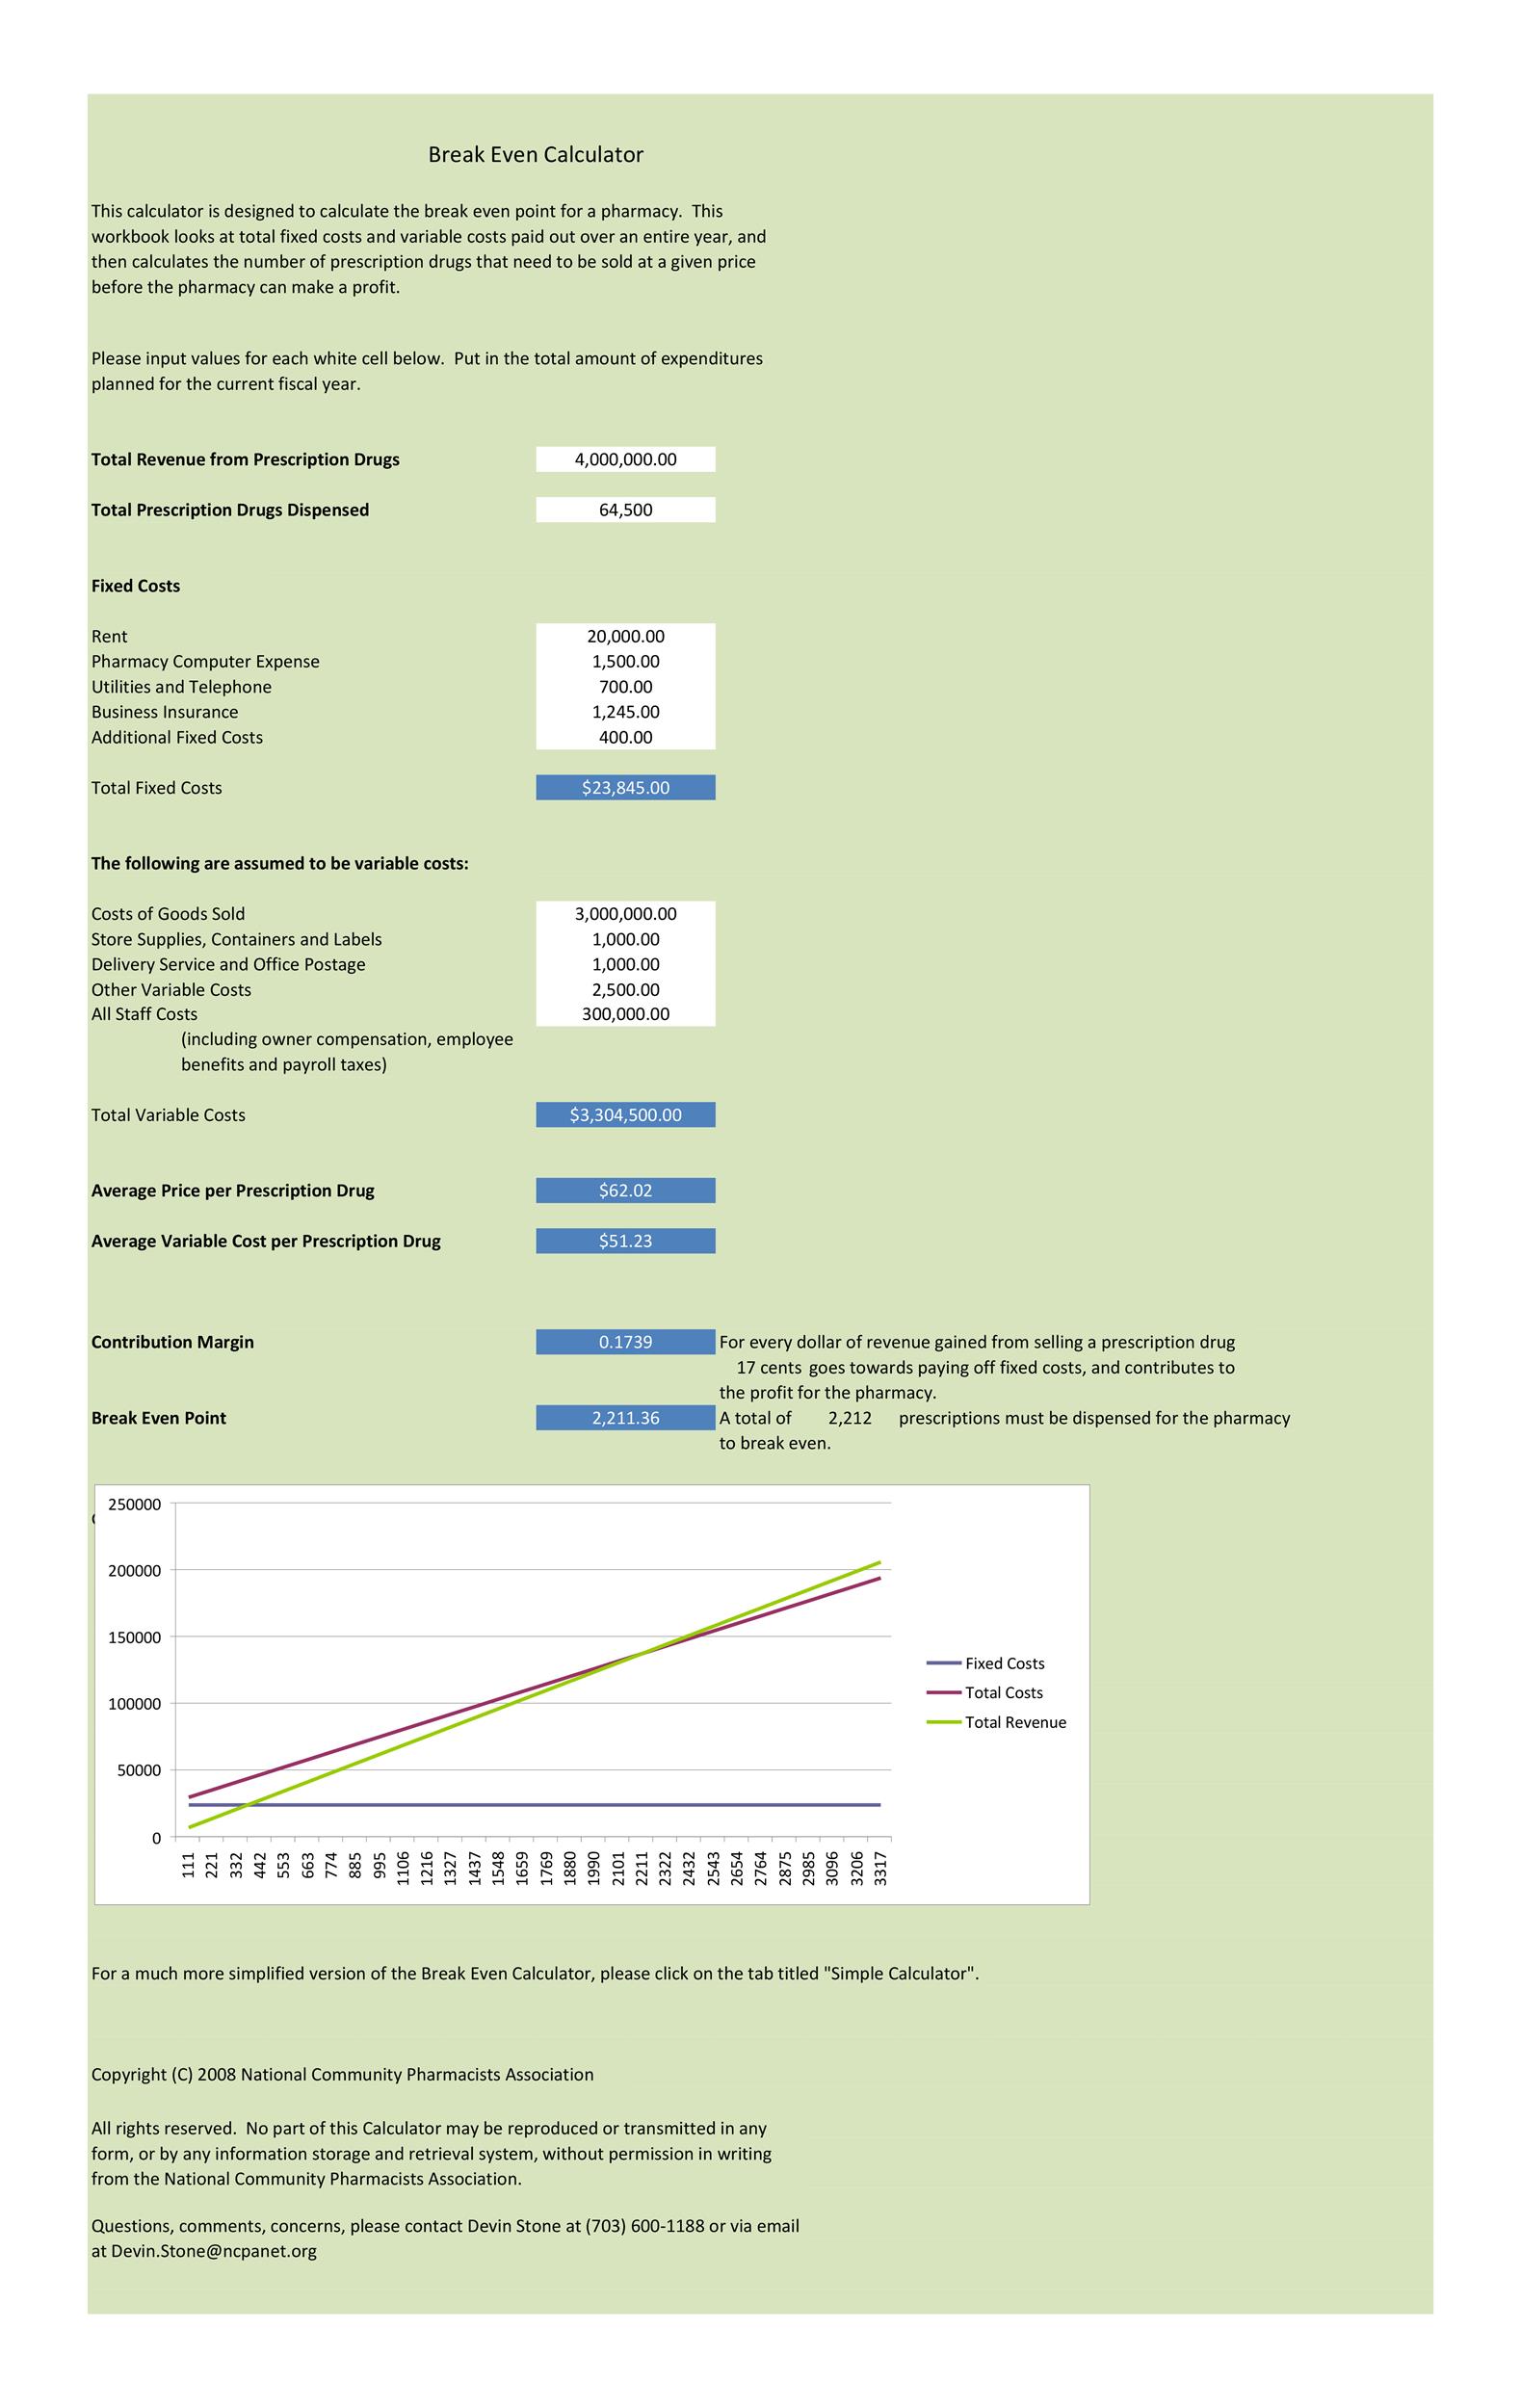
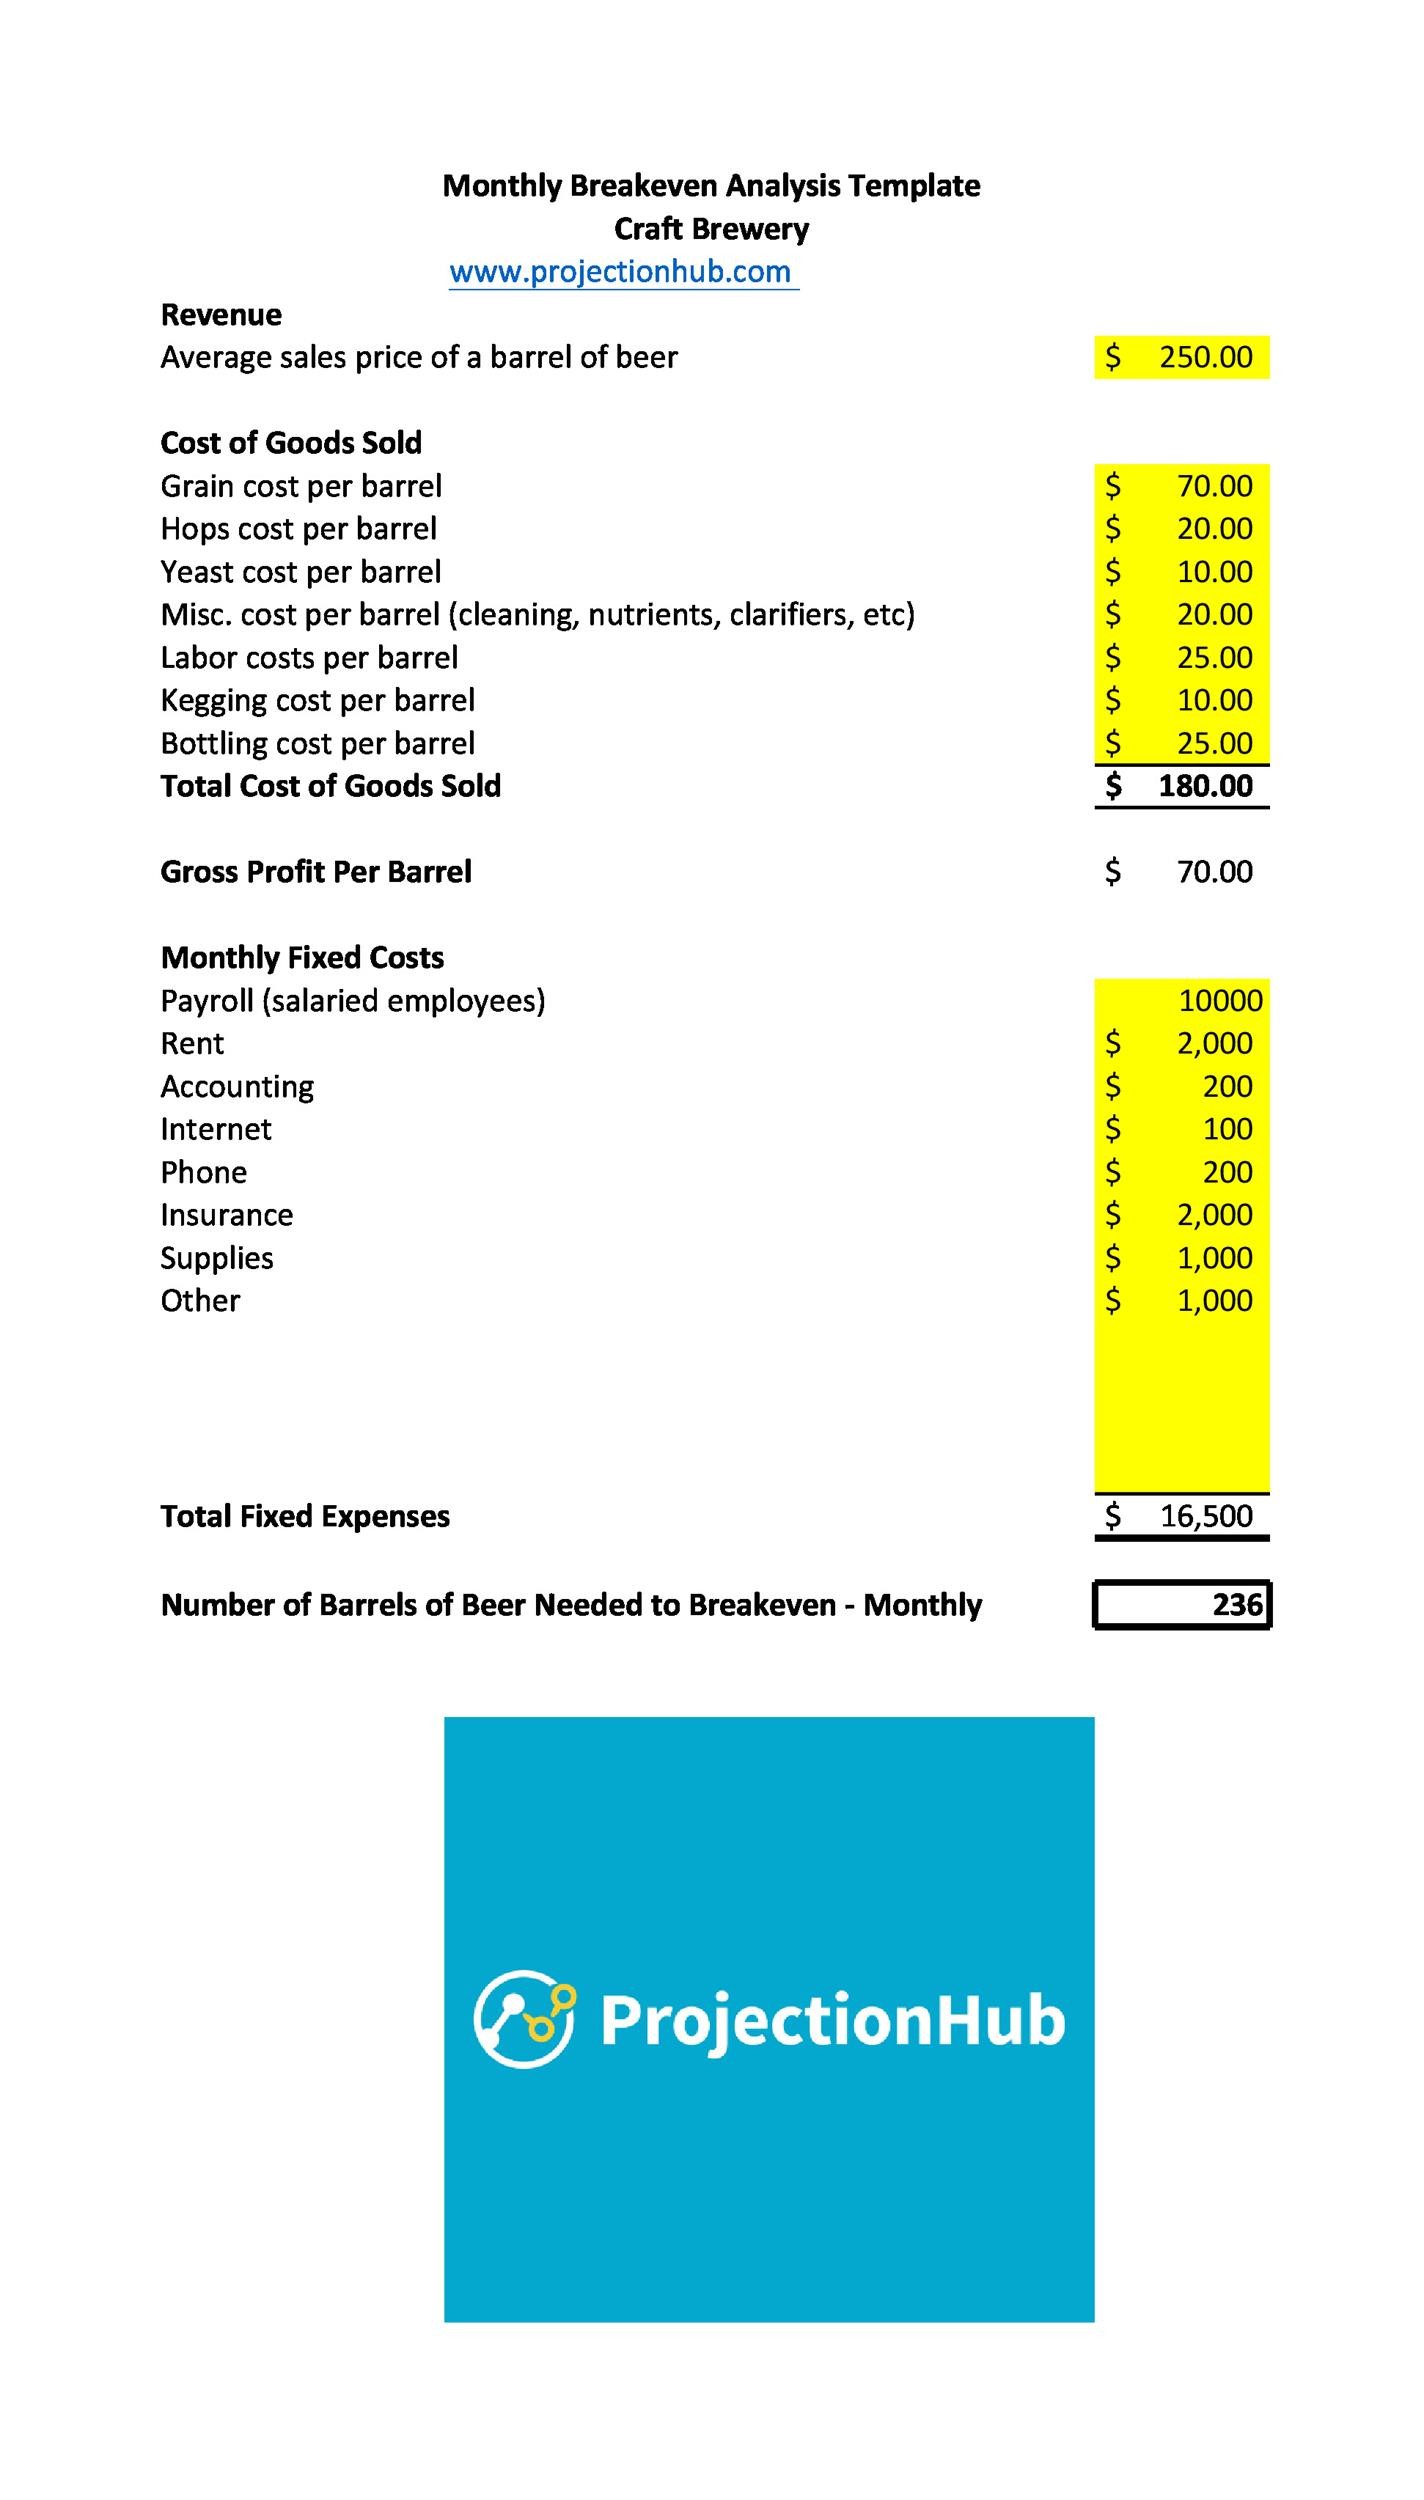
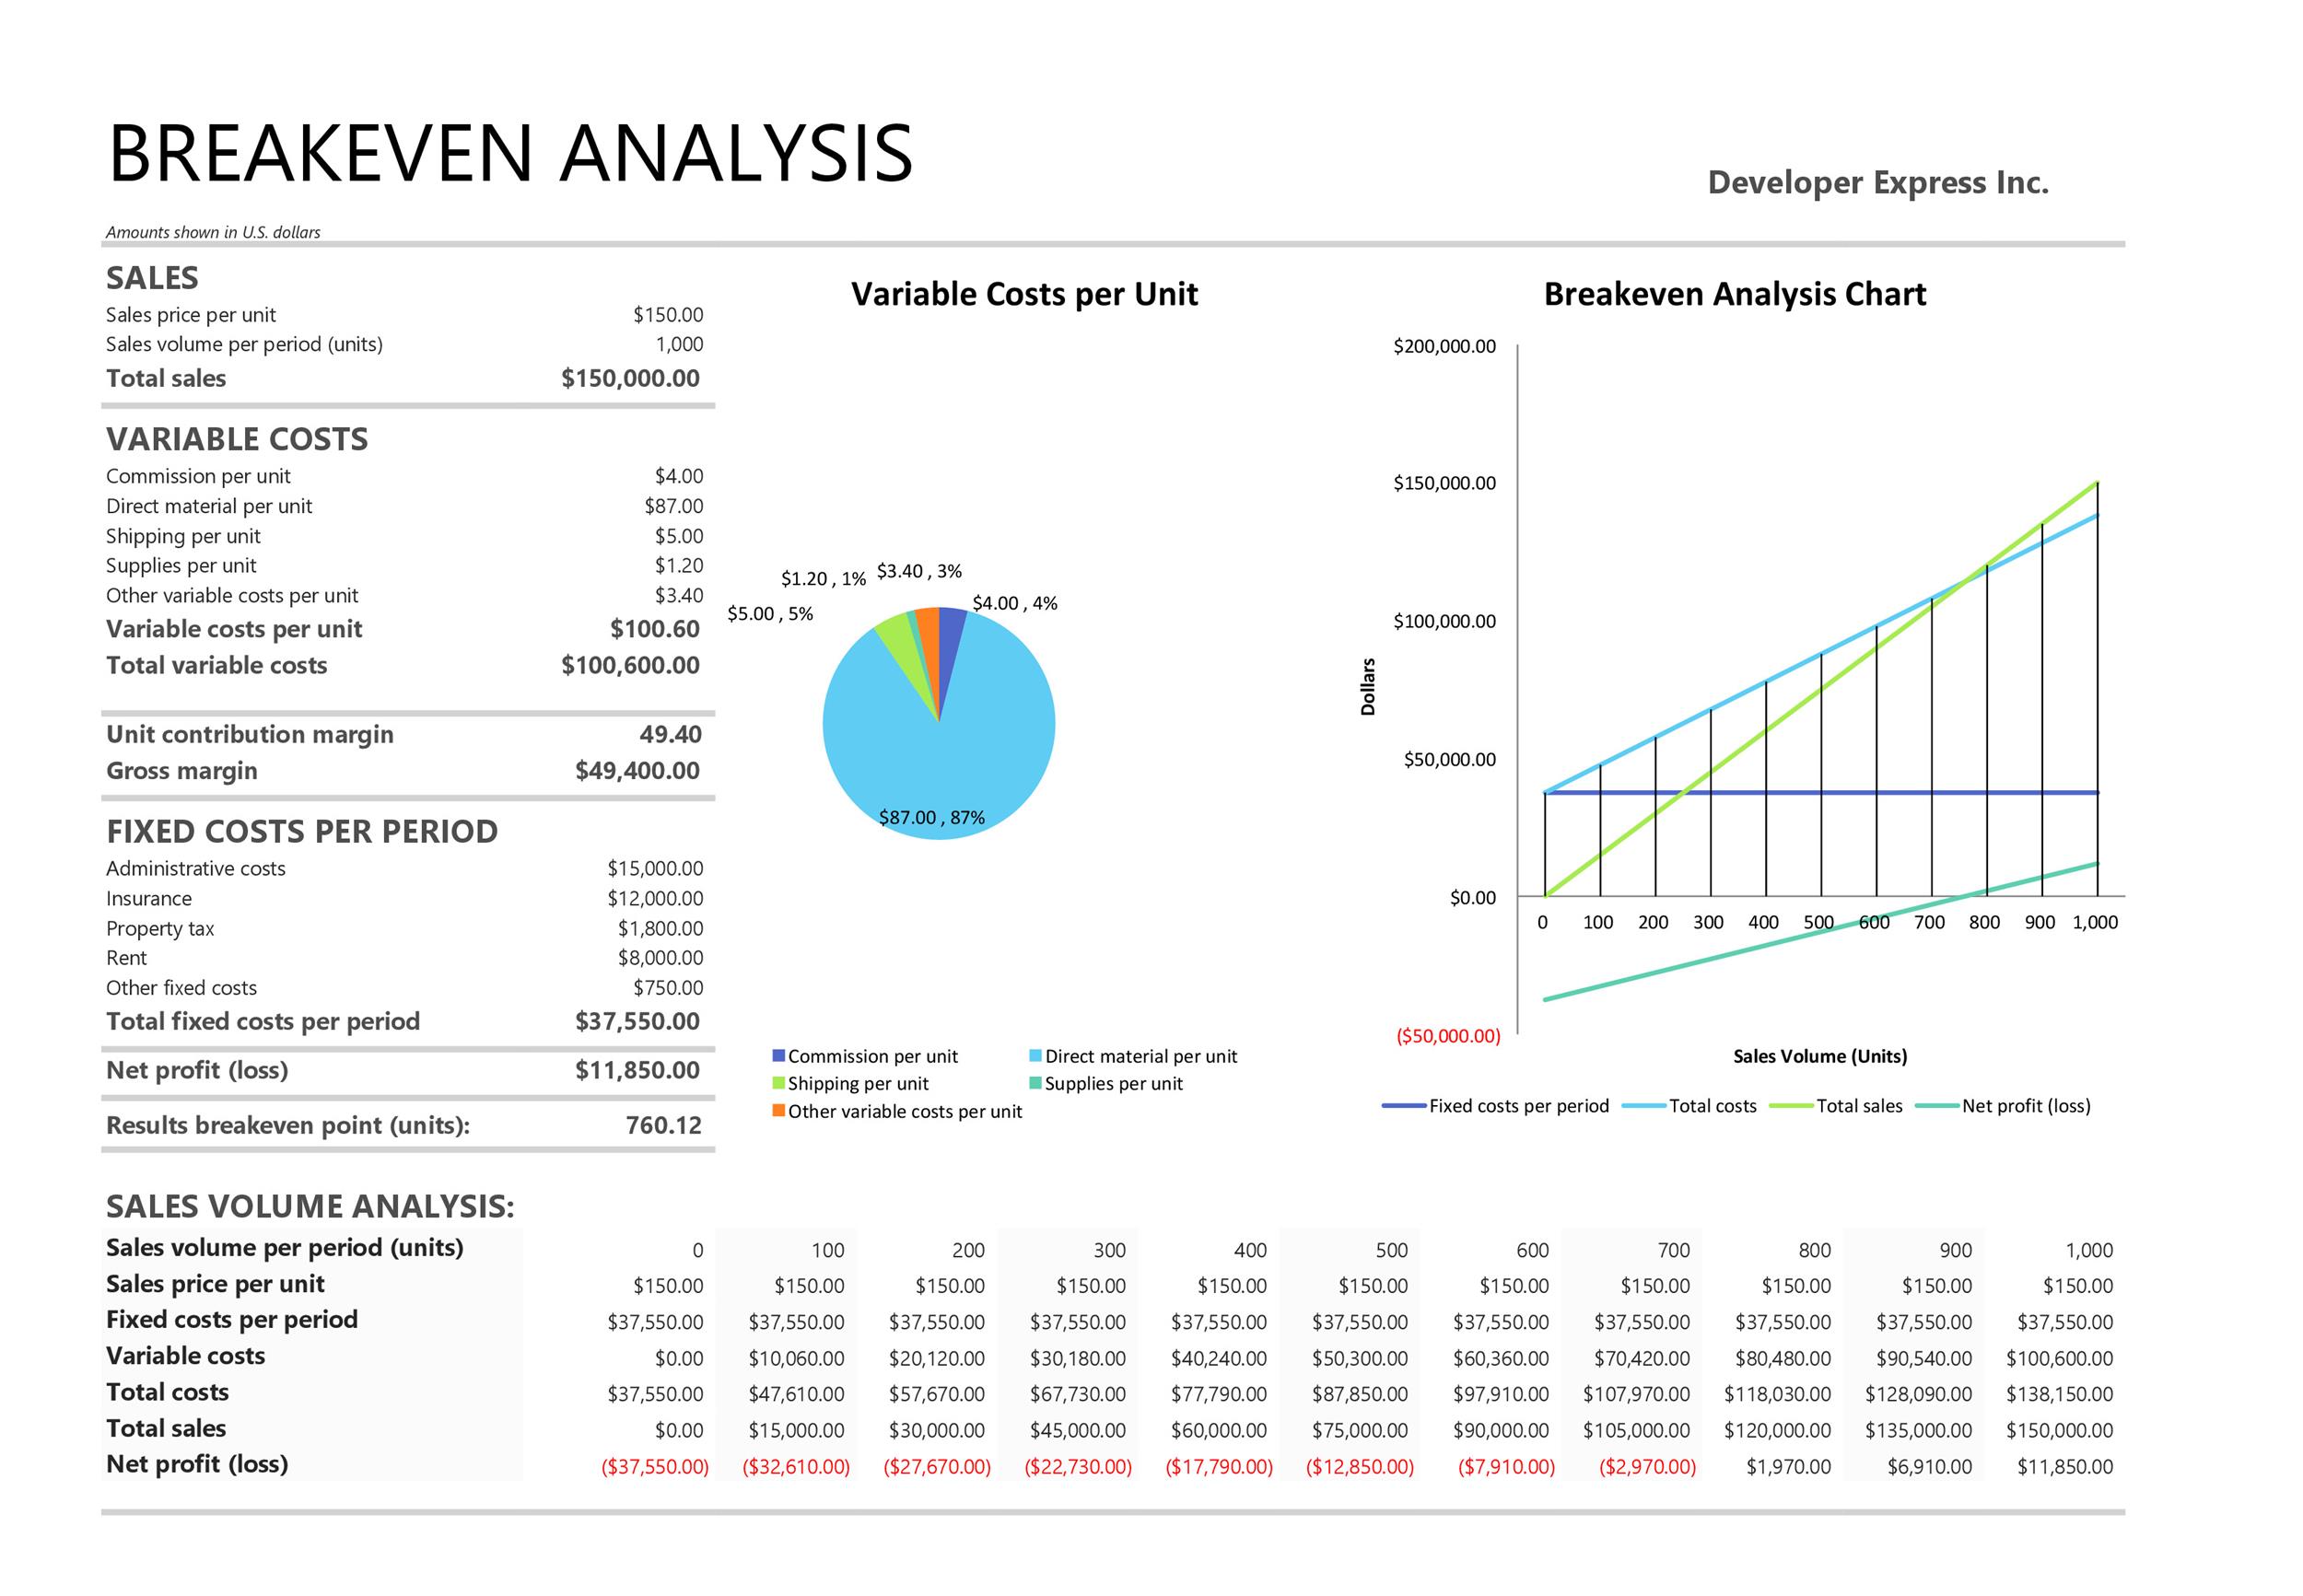
In business, you perform a break-even analysis for a specific purpose. You can use it to determine if your revenue will be able to cover all your expenses within a specific time period. Generally, businesses use a month as the time period in this analysis process.
If the revenue is more than the break-even point, then your company stands to gain profits. But if it doesn’t reach the point, your business may suffer losses. When performing such an analysis, you may need to create a break-even analysis in Excel.
Table of Contents
You can create the template yourself or download one from here. Some companies need to plan carefully in order to avoid any losses. You have to make accurate calculations.
To do this, you enter the data in a break-even spreadsheet and use that for your analysis. In different types of businesses, there are different things to consider. That is if you want to gain profit rather than suffer losses.
Some startup businesses use such an analysis to calculate financial viability. Through it, they can determine whether it’s feasible to pursue a new venture or release a new product. This process is a tool that’s usually part of a strong business plan.
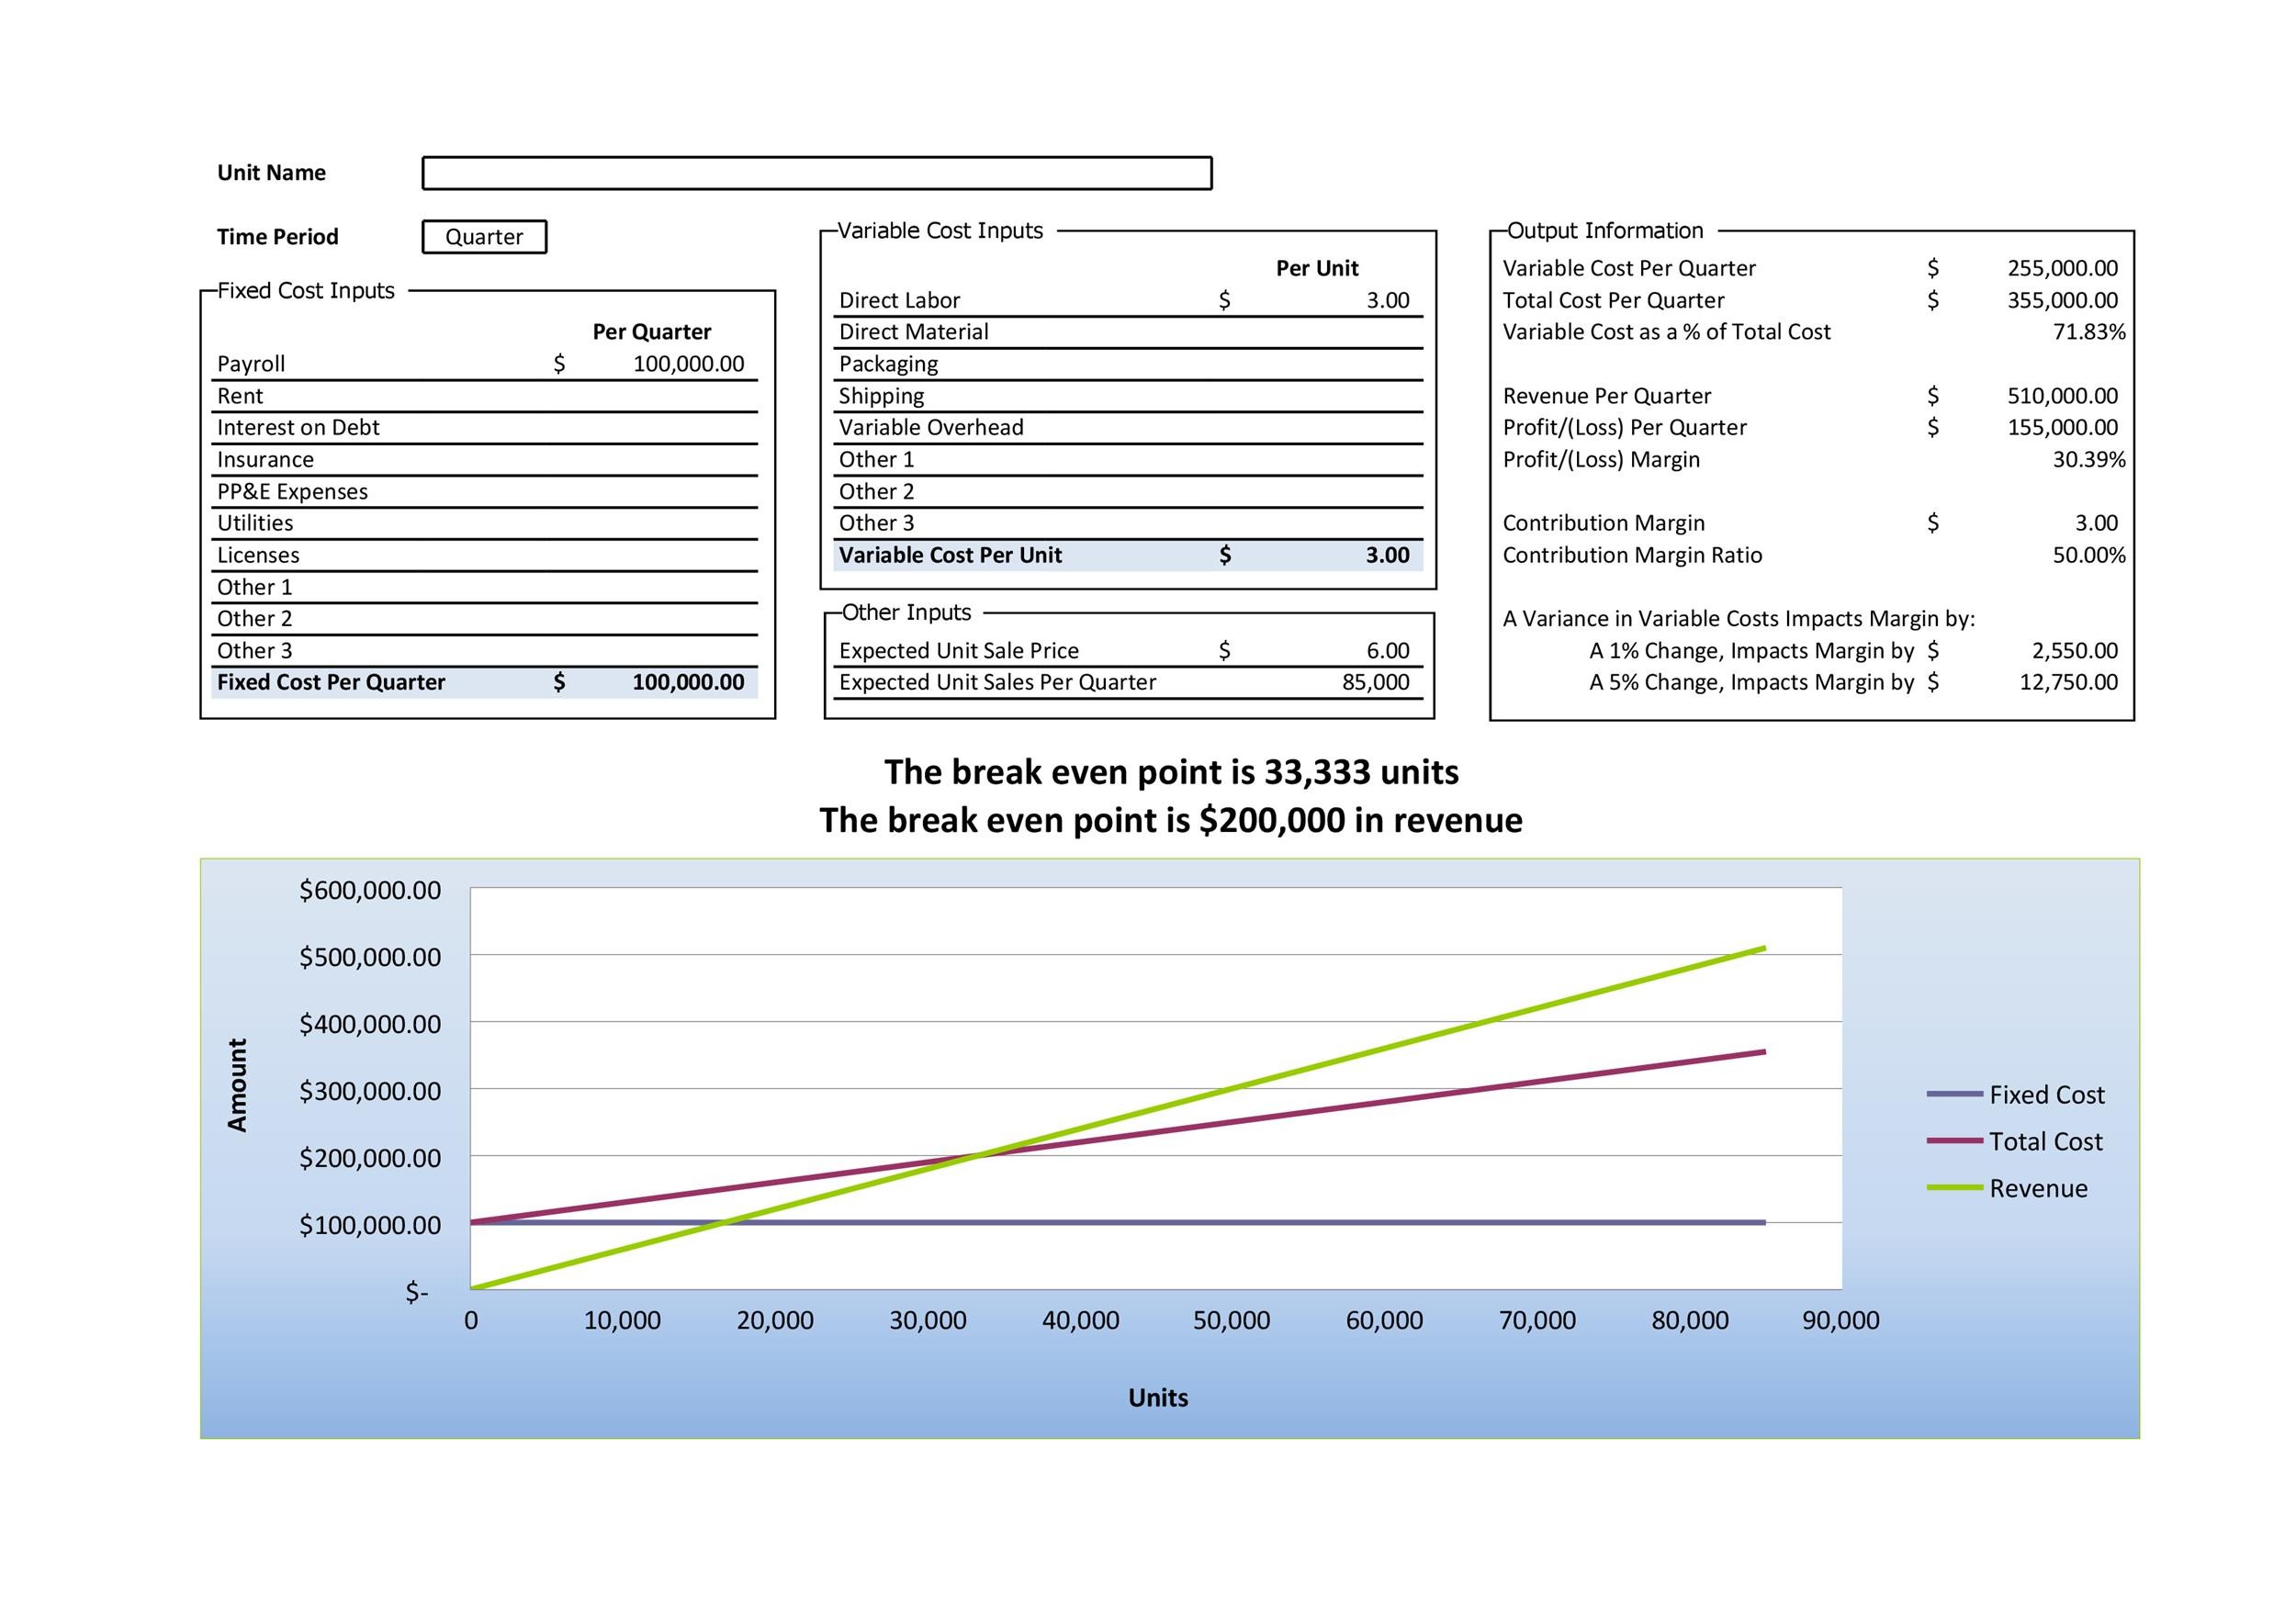
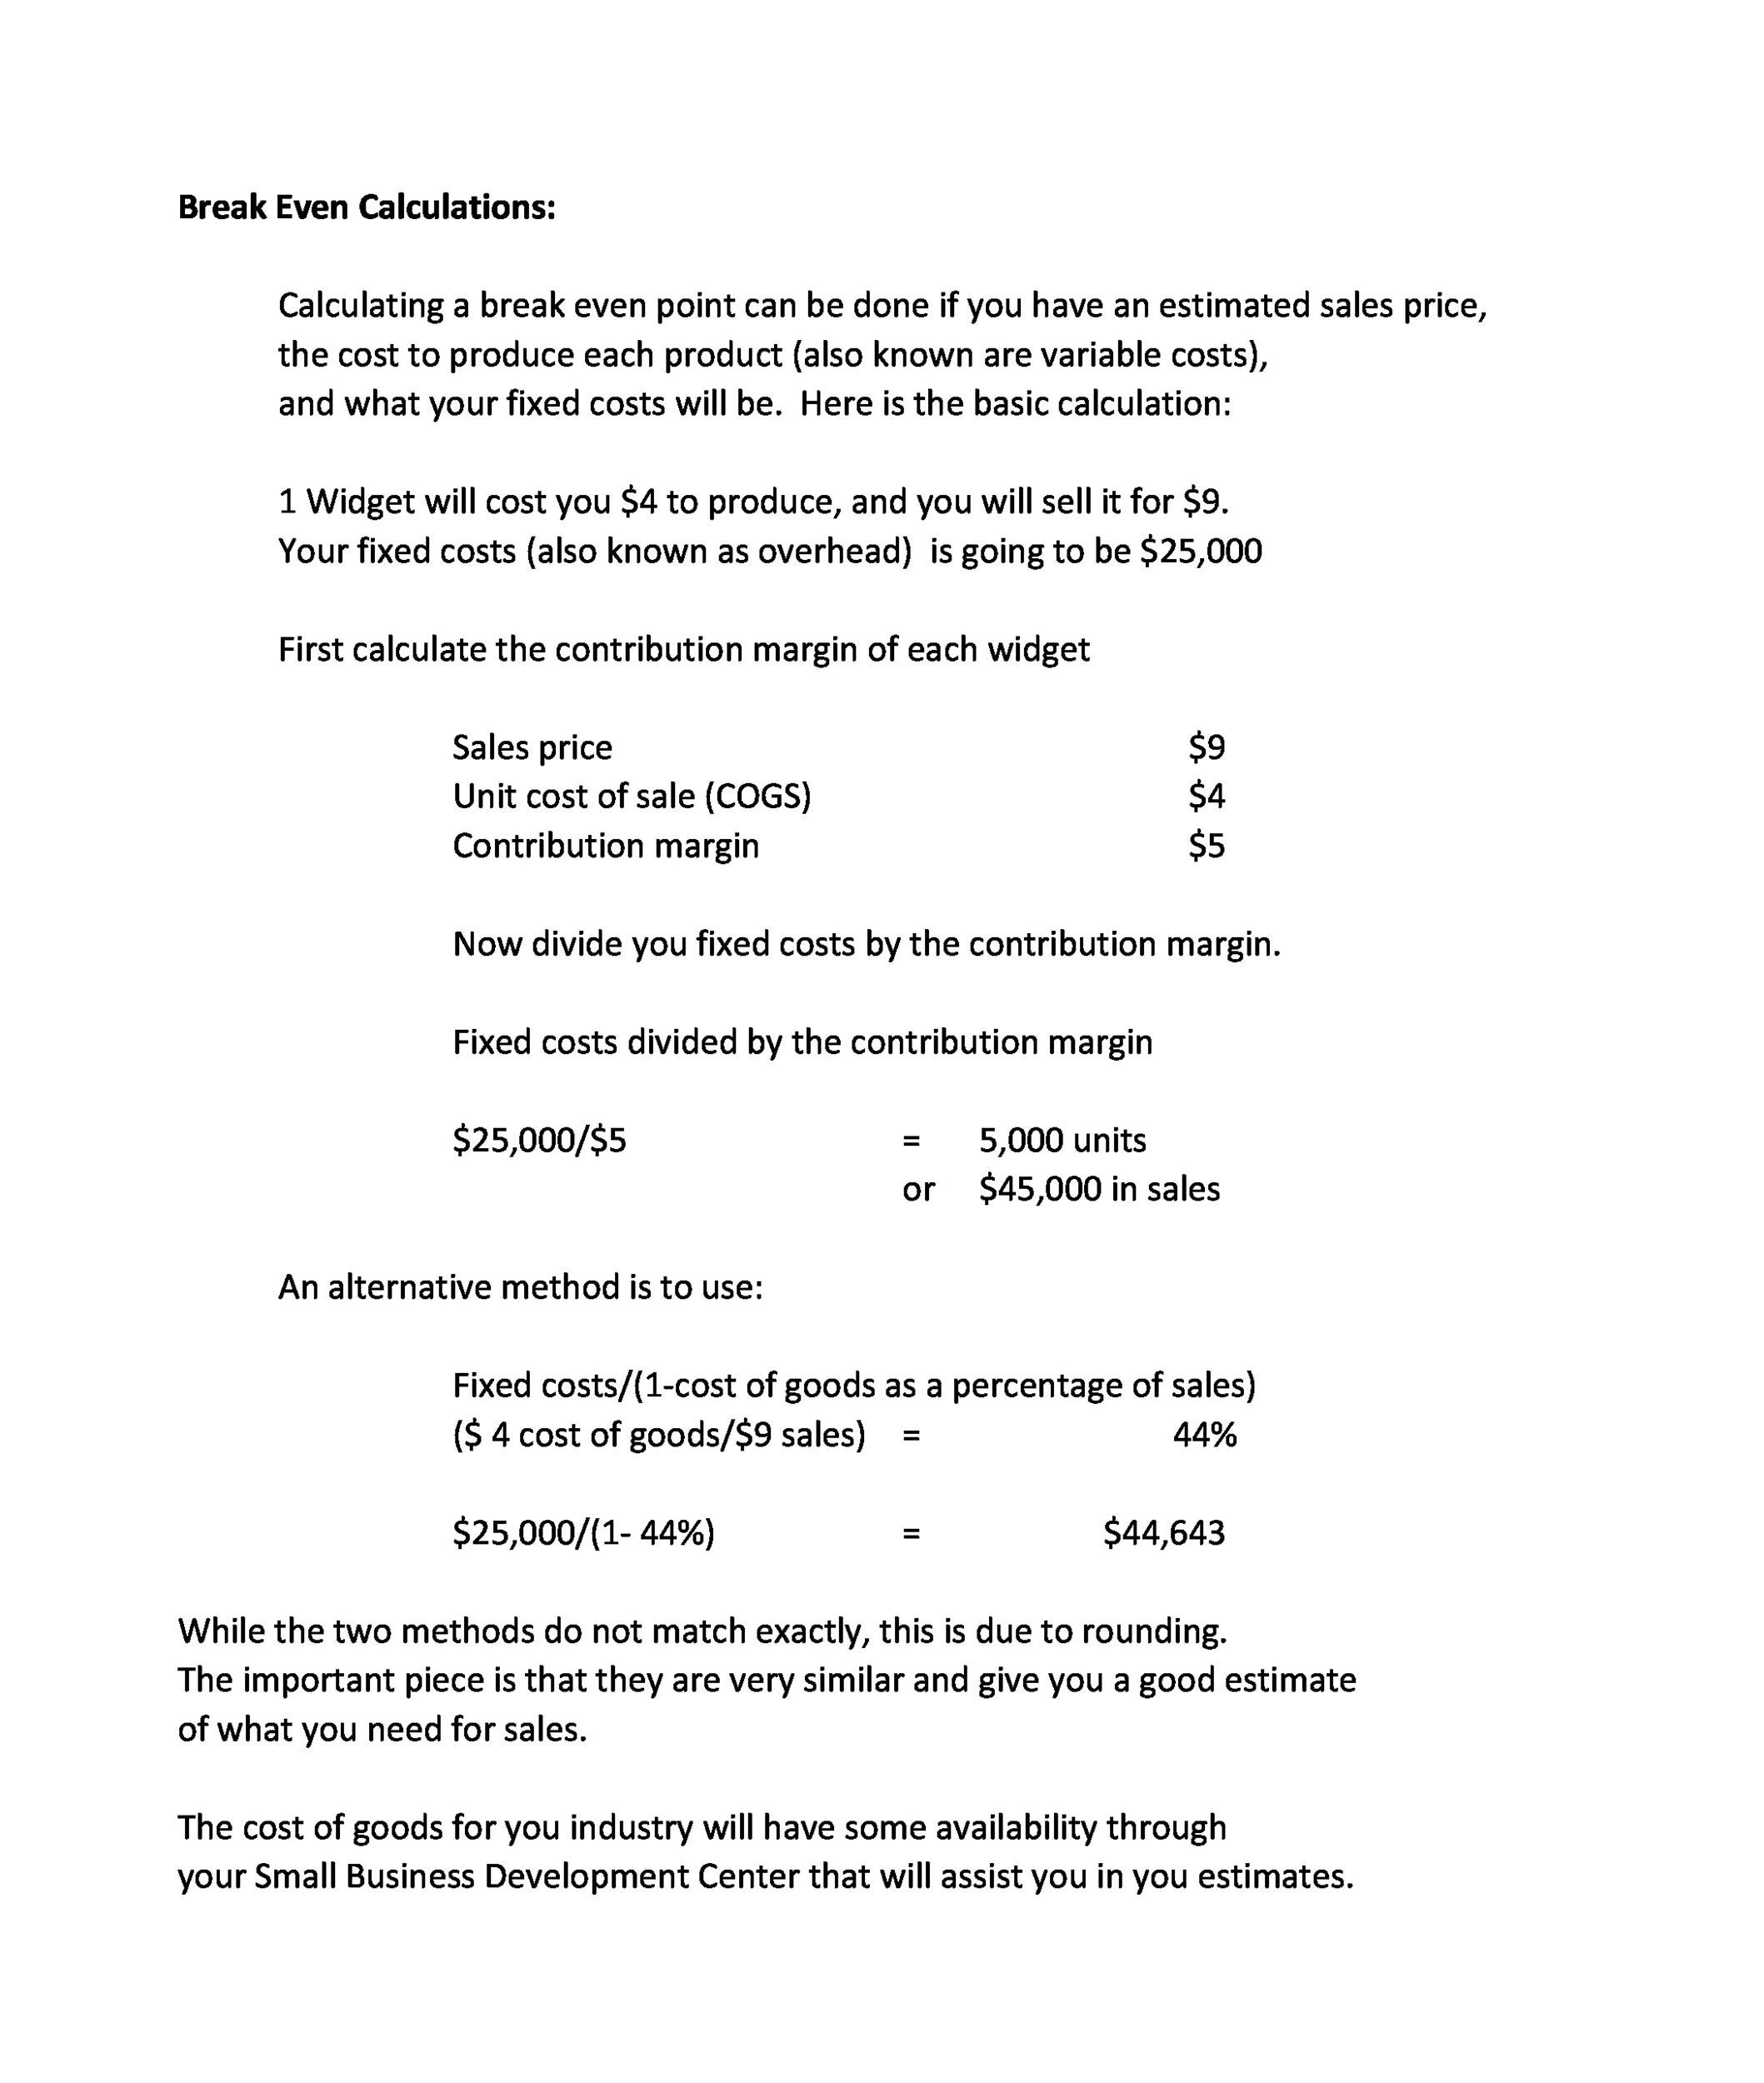
Calculating the break-even point is fairly simple. What’s challenging is coming up with the other variables. These include the sale price, projected sales, fixed, and variable costs. The business owner still needs to come up with all these in order to complete the template.
Break Even Analysis Templates
Common terminologies used in break-even analysis
You may have a plan to make a break-even analysis template. Before that, you need to know the different terminologies to use. These basic terminologies are important if you want to make accurate calculations. You need to understand what they mean and why they are part of the analysis.
- Fixed costs
This refers to costs which remain constant throughout the payback period. They don’t depend on how many units you produced within that period. These include insurance, advertising, rent, taxes, supplies, and more.
There are a lot of fixed costs involved in a business. They may also include the wages and payroll taxes you give to non-direct labor. - Payback period
This is how long it would take your investment to reach the break-even point. When you’re making an analysis, you need to calculate that point. Before you can do that, you need to define your payback period already.
This period may be a few years or just a matter of months. It would depend on the change rate in your market.
If you’re starting your business, you’ll definitely need this information. Banks or financial institutions may ask for evidence. They’ll want to prove that you’ll start making a profit after a certain amount of time. - Sales price
This refers to the price you’re selling your products for. Whether it be goods or services, you need to establish the sales price. Usually, this value remains constant when you’re making an analysis.
Then you can compute your total revenue by multiplying this value by the number of products sold. - Variable costs
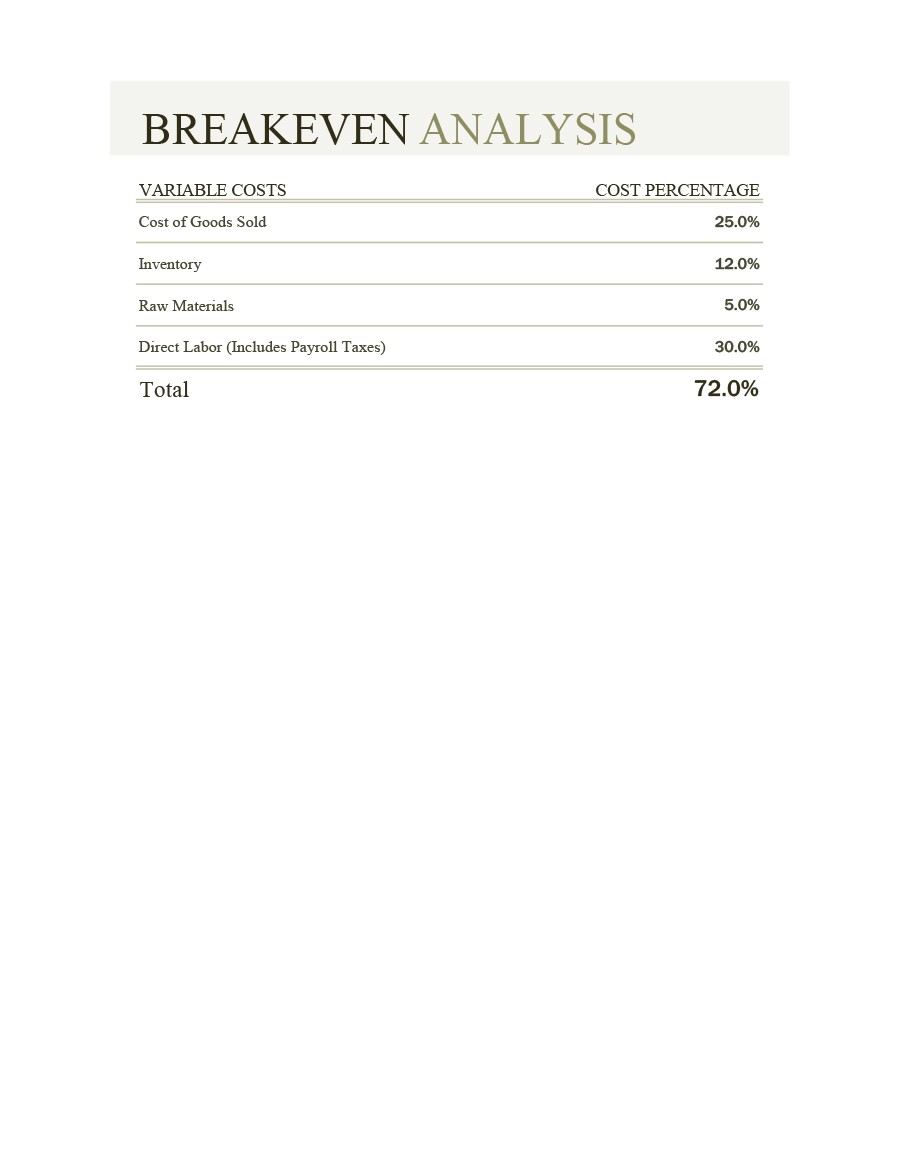
There are a lot of factors which you can consider as variable costs. These include direct labor, production, materials, and other costs. The costs usually depend on how many products you’ve made and how many you’ve sold.
Some variable costs may be currency-based while some are percentage-based.
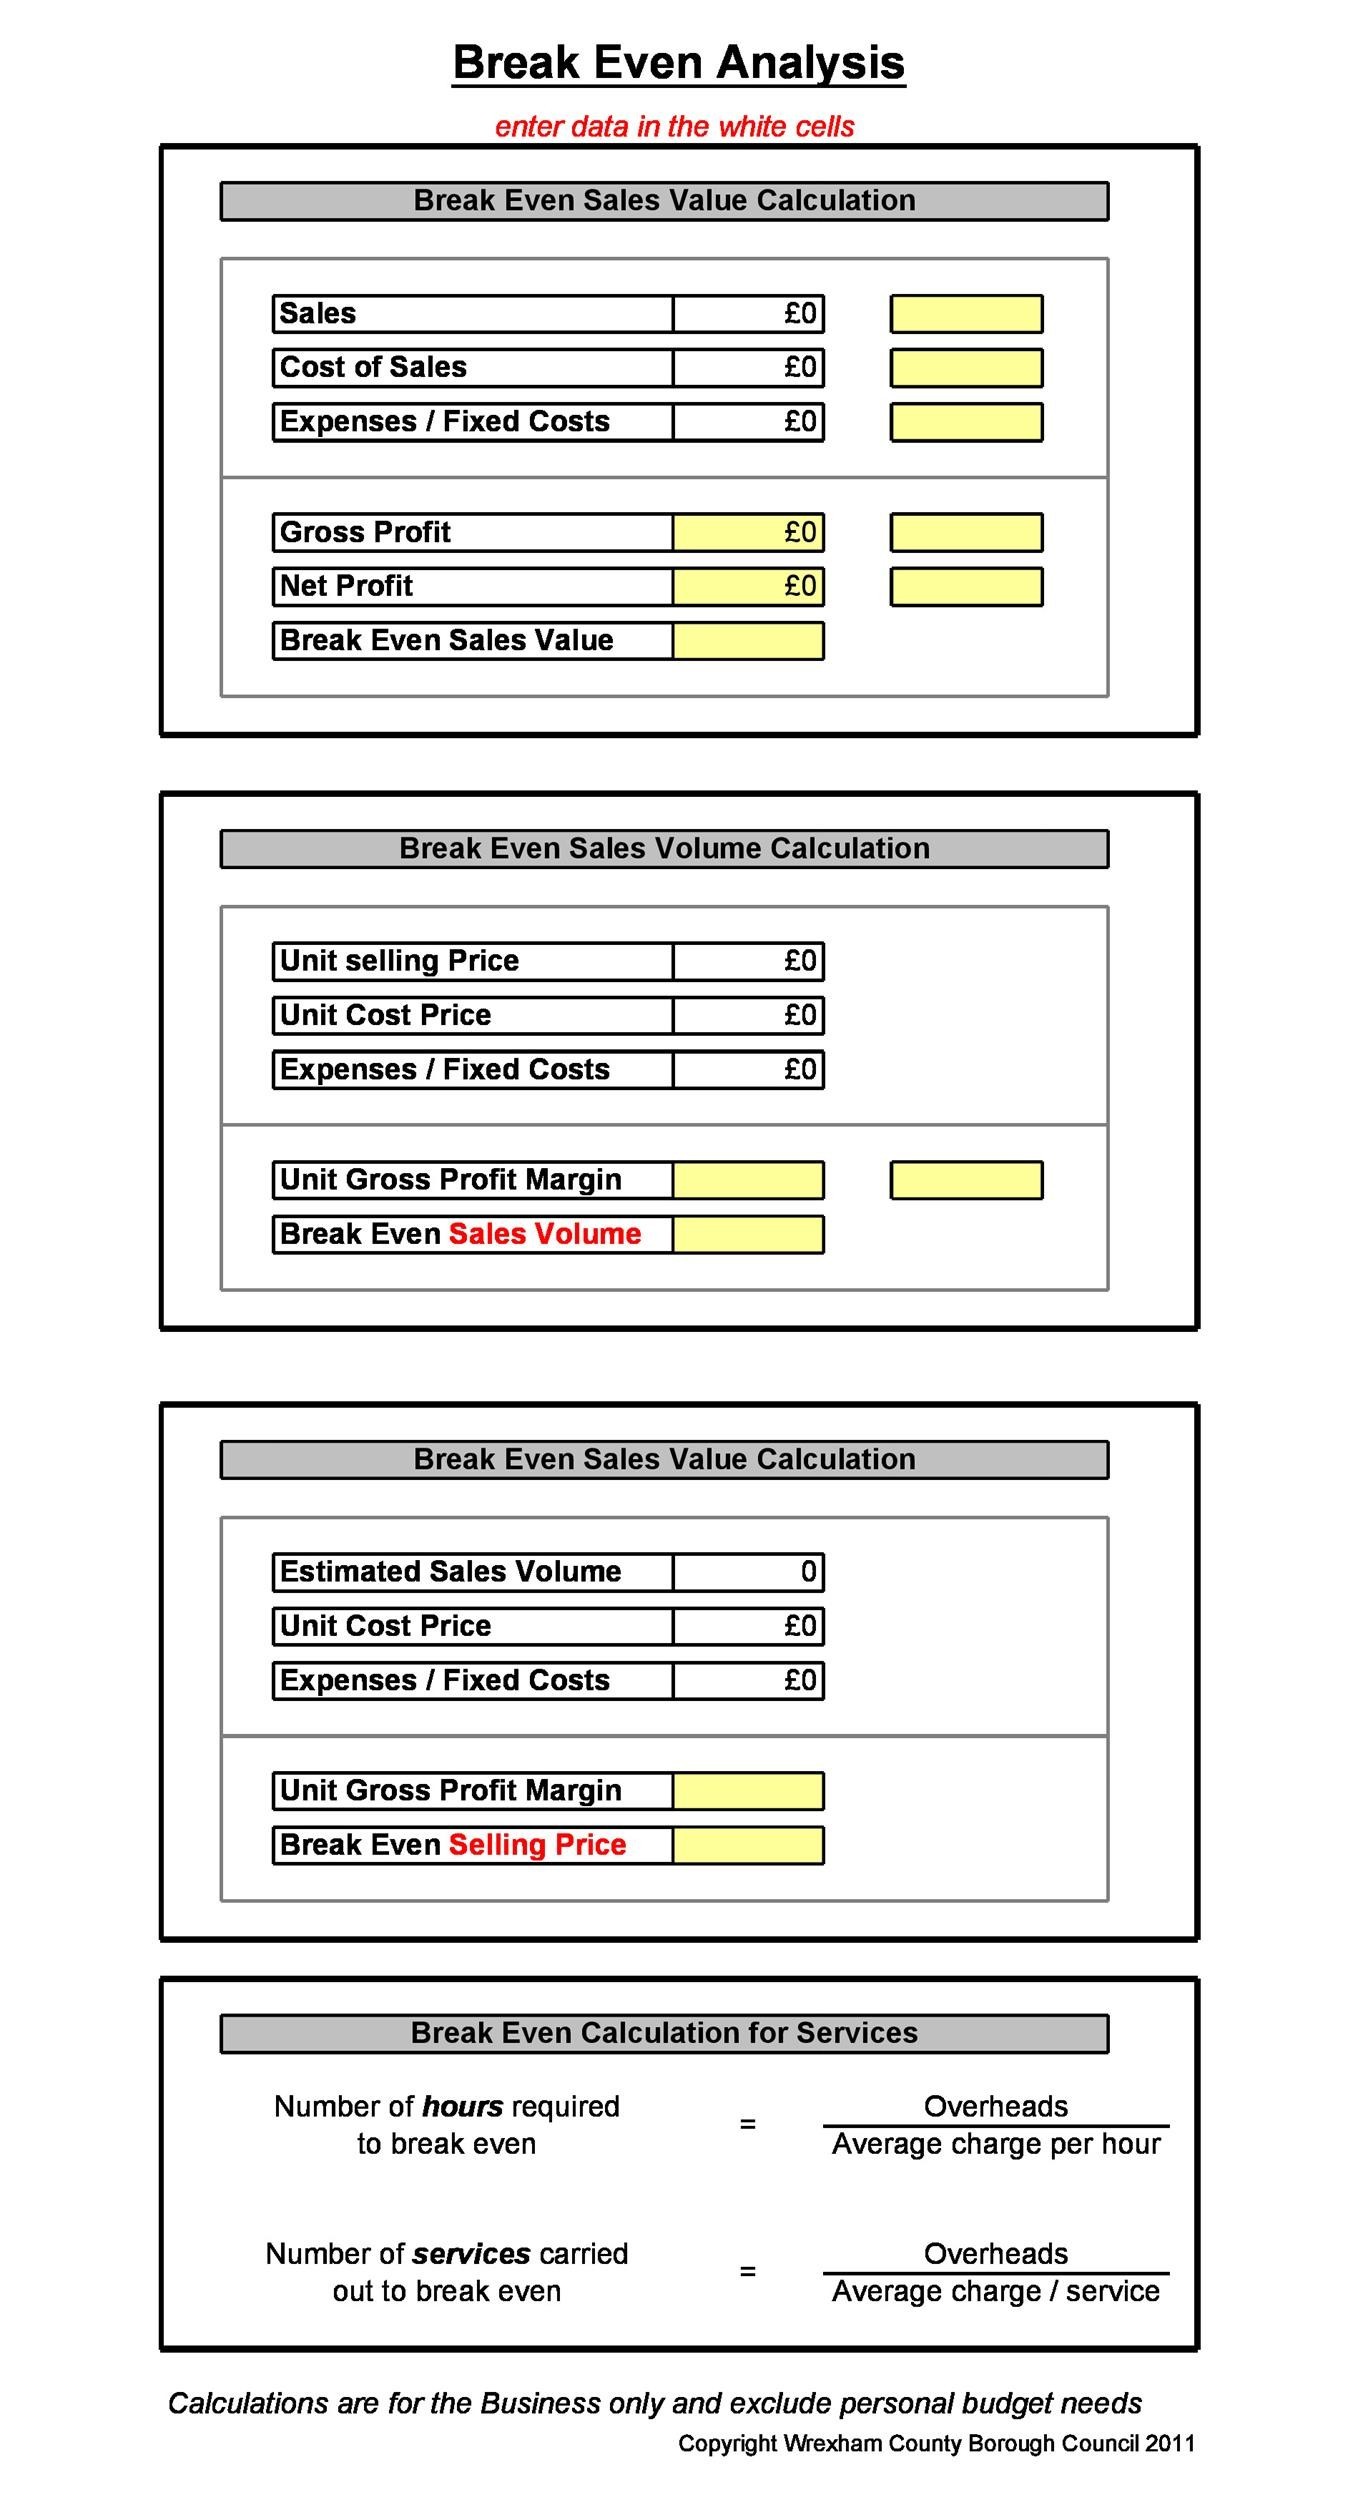
These are the most basic terminologies. You need to understand them if you’re planning to make a break-even analysis. When you perform this, you need a break-even spreadsheet. In it, you’ll input all the relevant information.
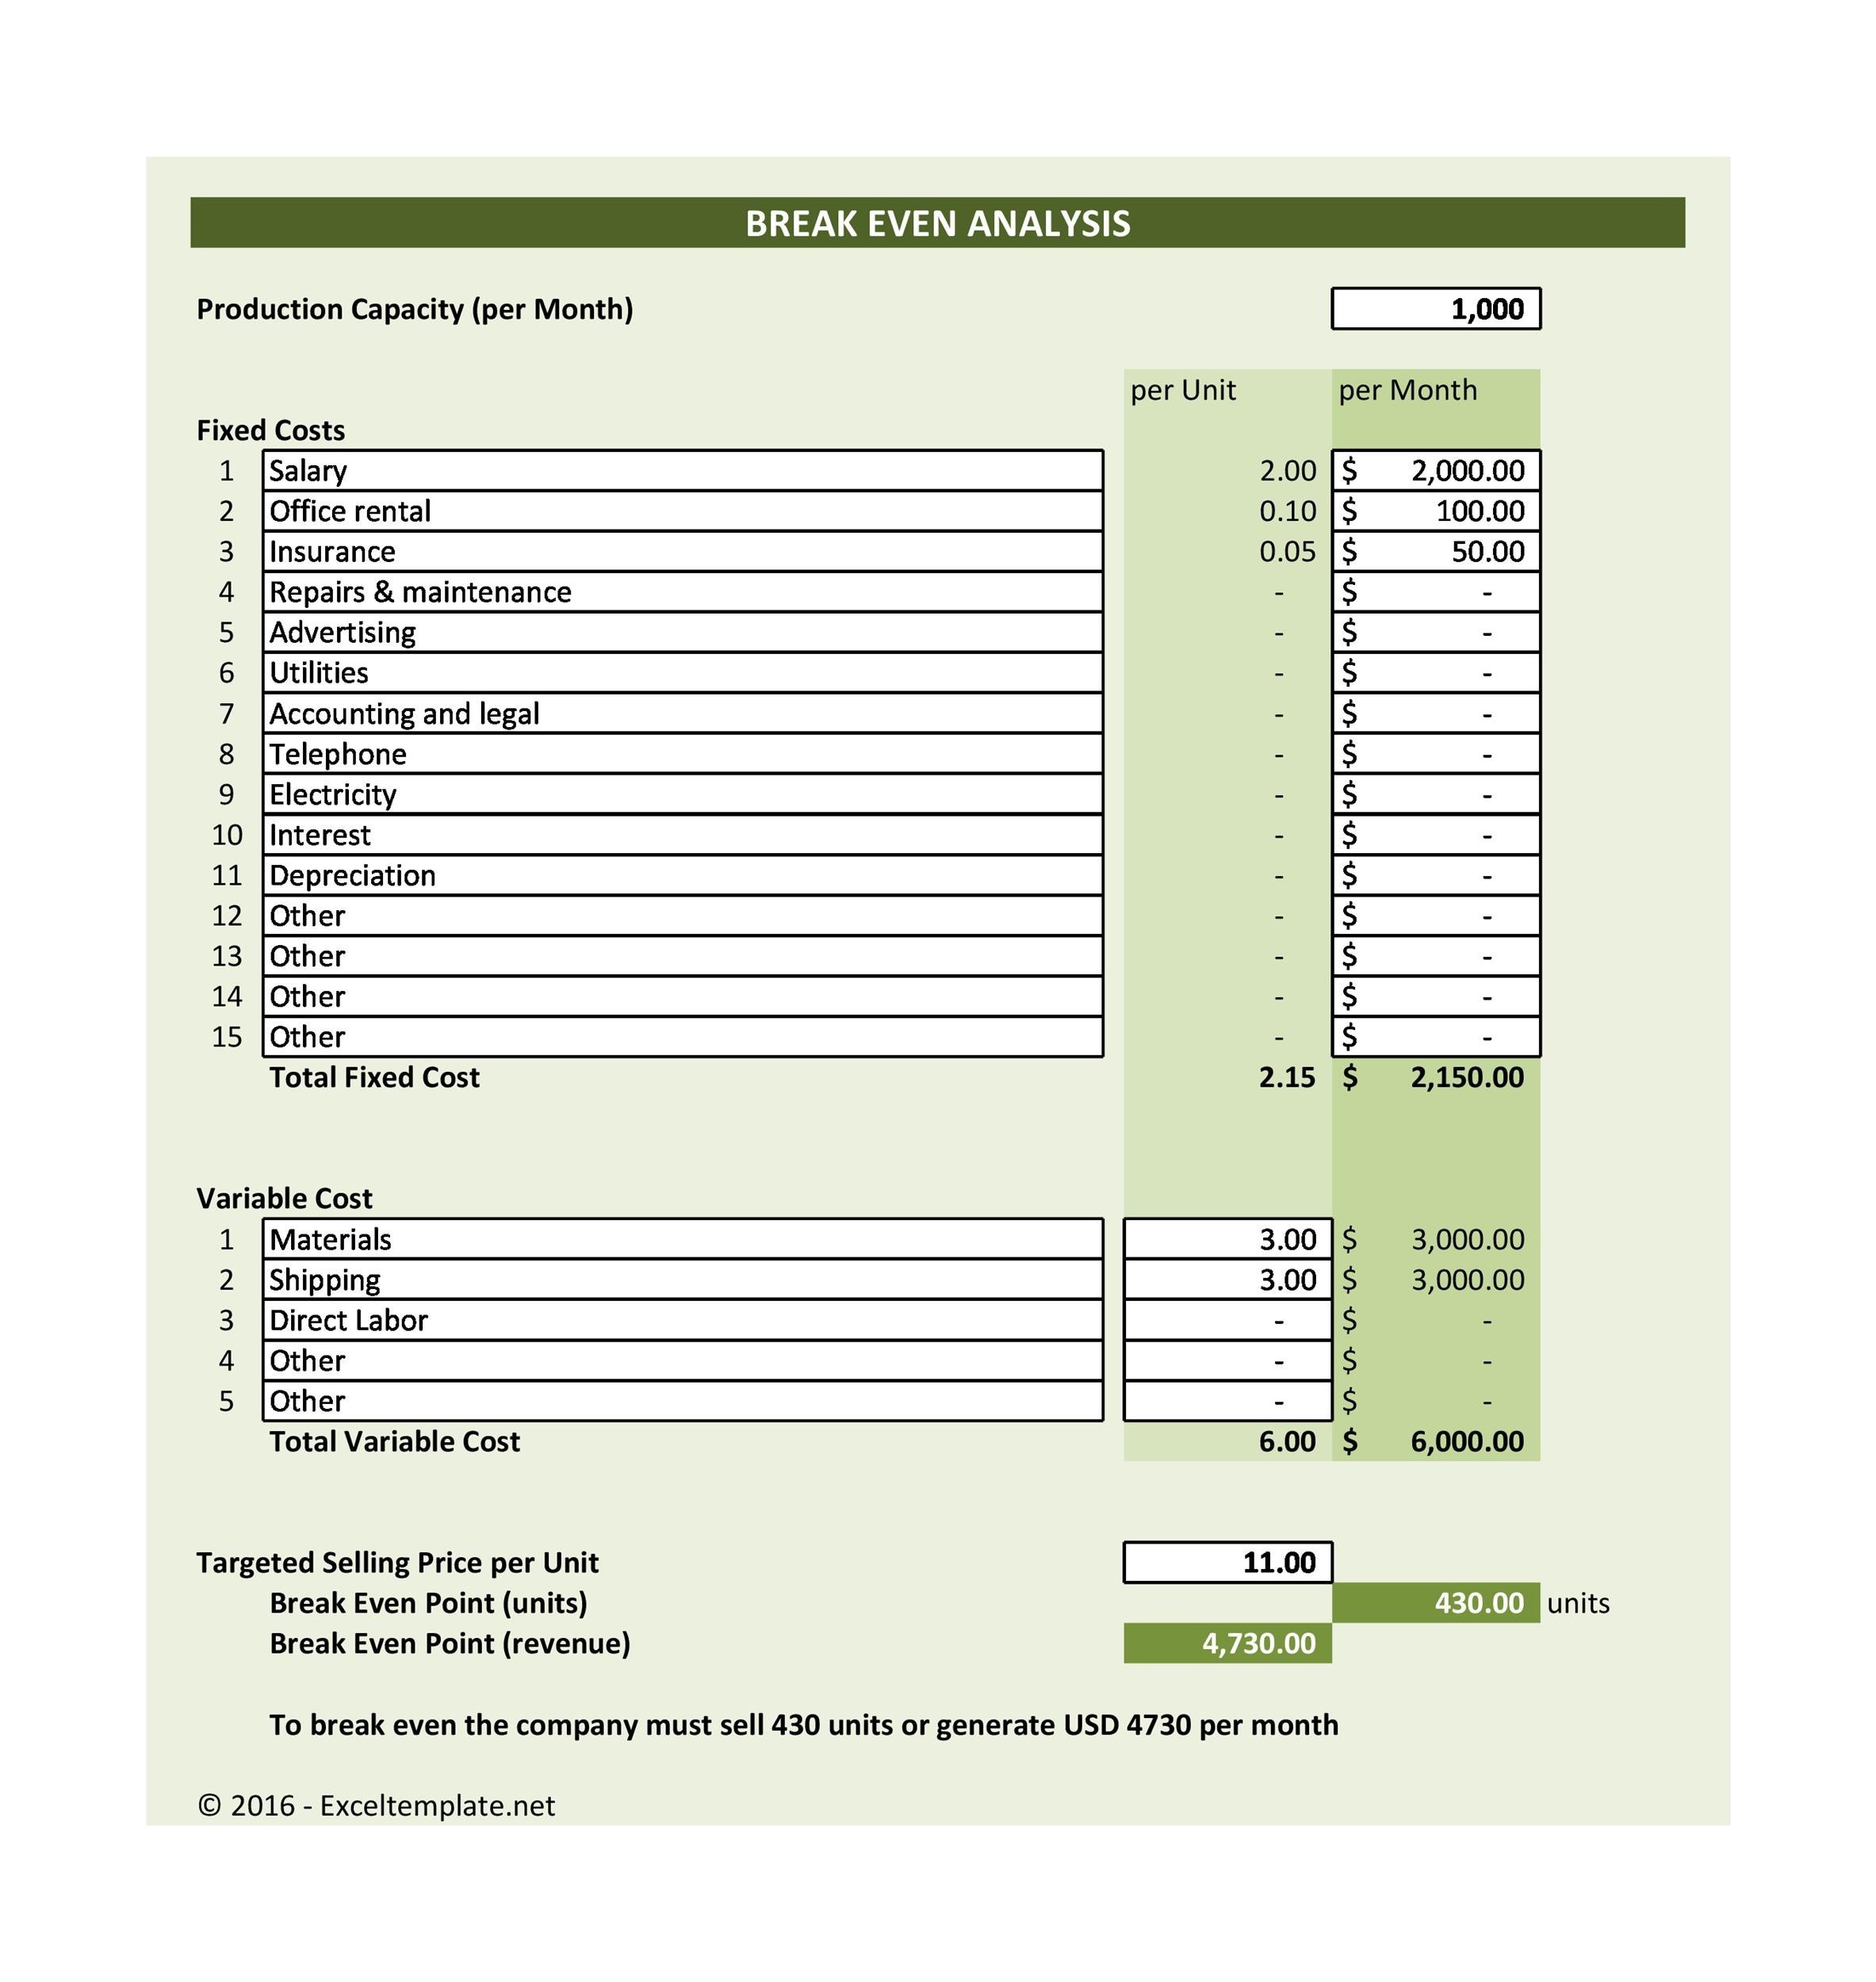
You can download a template here or create one on your own. To help you out, we’ll discuss some helpful steps next.
Break Even Spreadsheet
Creating your own break-even analysis template in Microsoft Excel
It’s important for businesses to perform a break-even analysis. You need to know the appropriate price you should charge for your goods or services. This information can make or break your business.
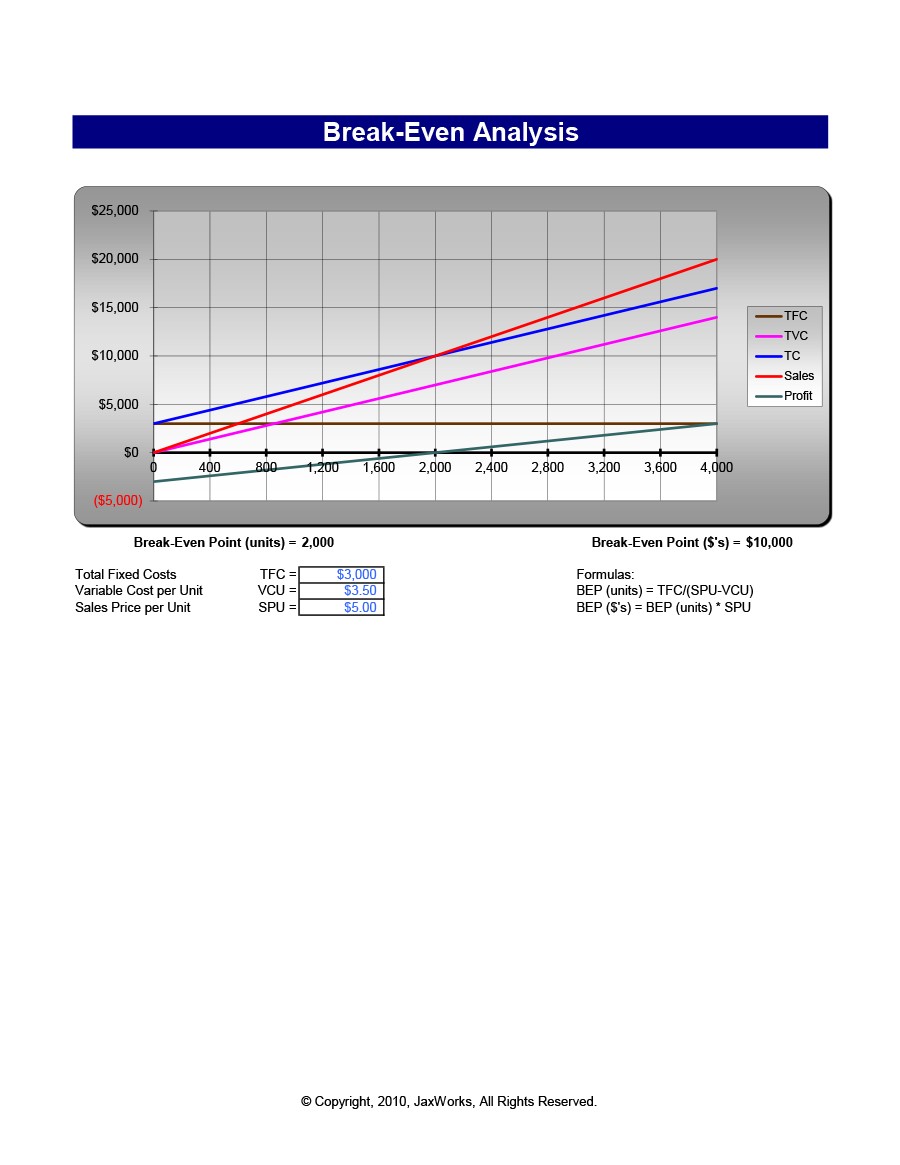
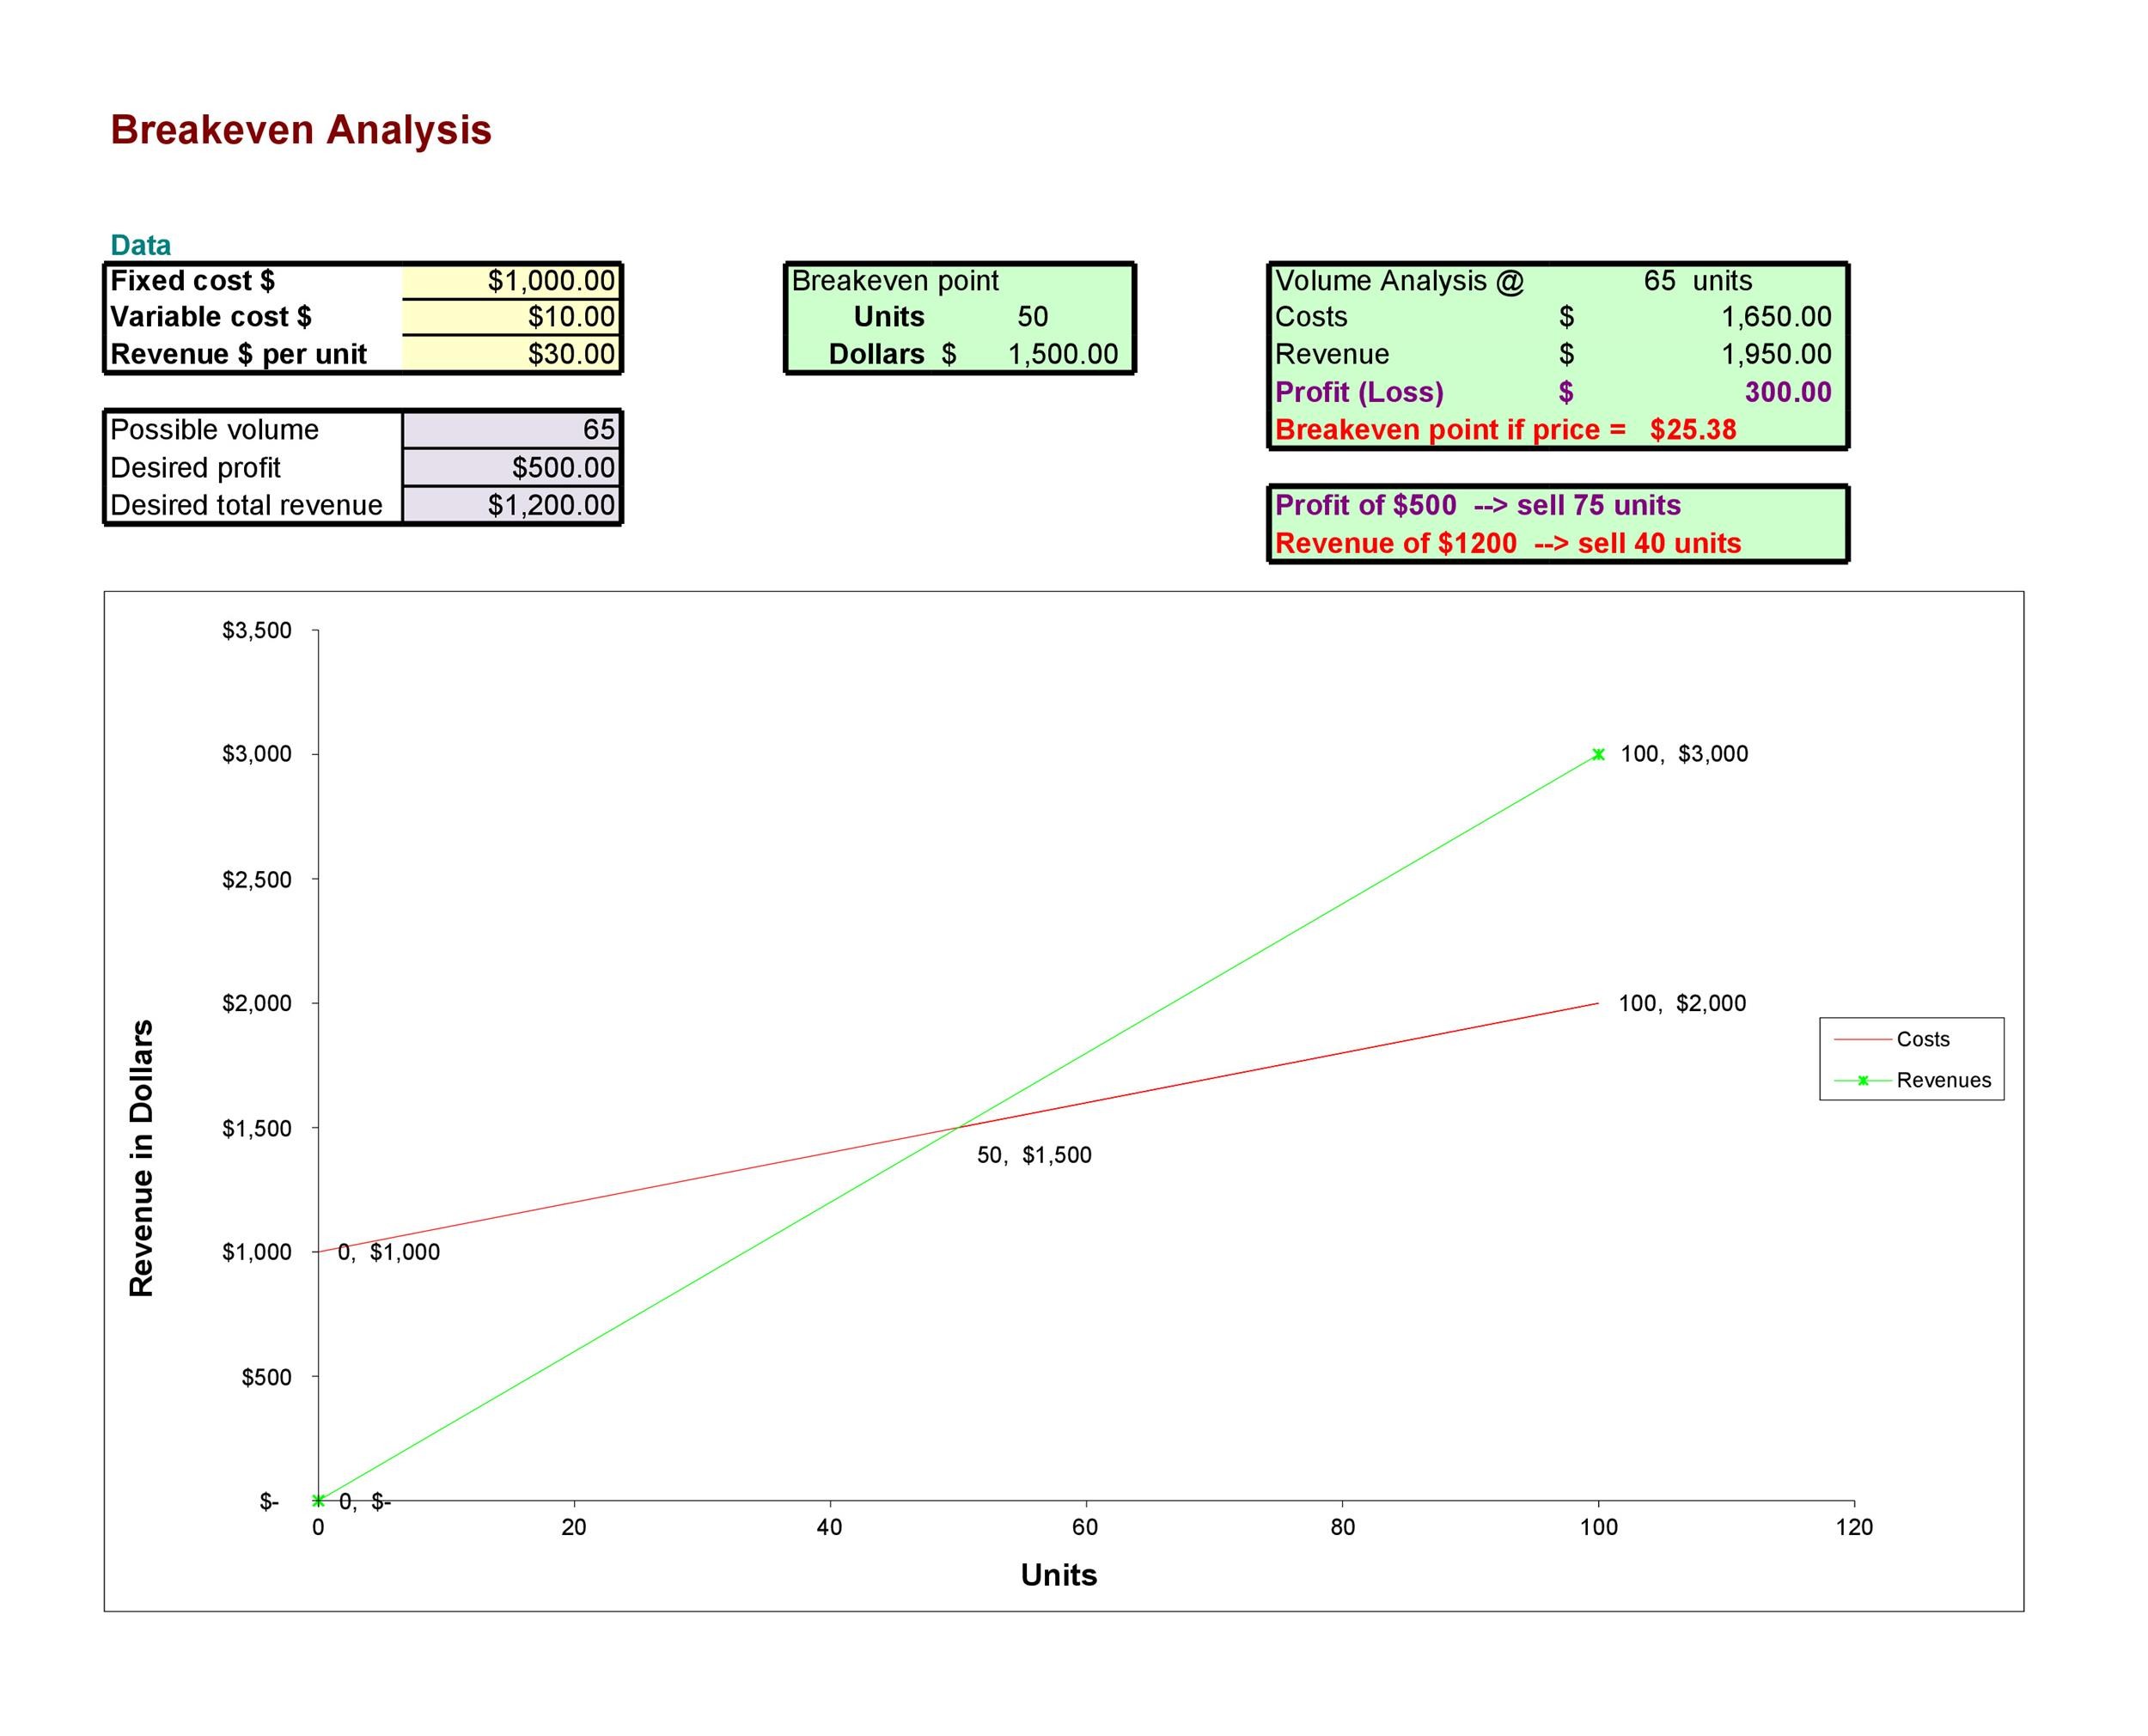
Part of making the decision would depend on the analysis process. The break-even point or BEP is the point where your costs will be equal to your sales (revenue). When you reach this point, it means your product is making a profit but you’re still covering your costs.
So if the value goes beyond the BEP, it means you’re making a profit. But if the value falls below the BEP, you’re suffering a loss. Before you make your analysis, you need to come up with some variables. There are:
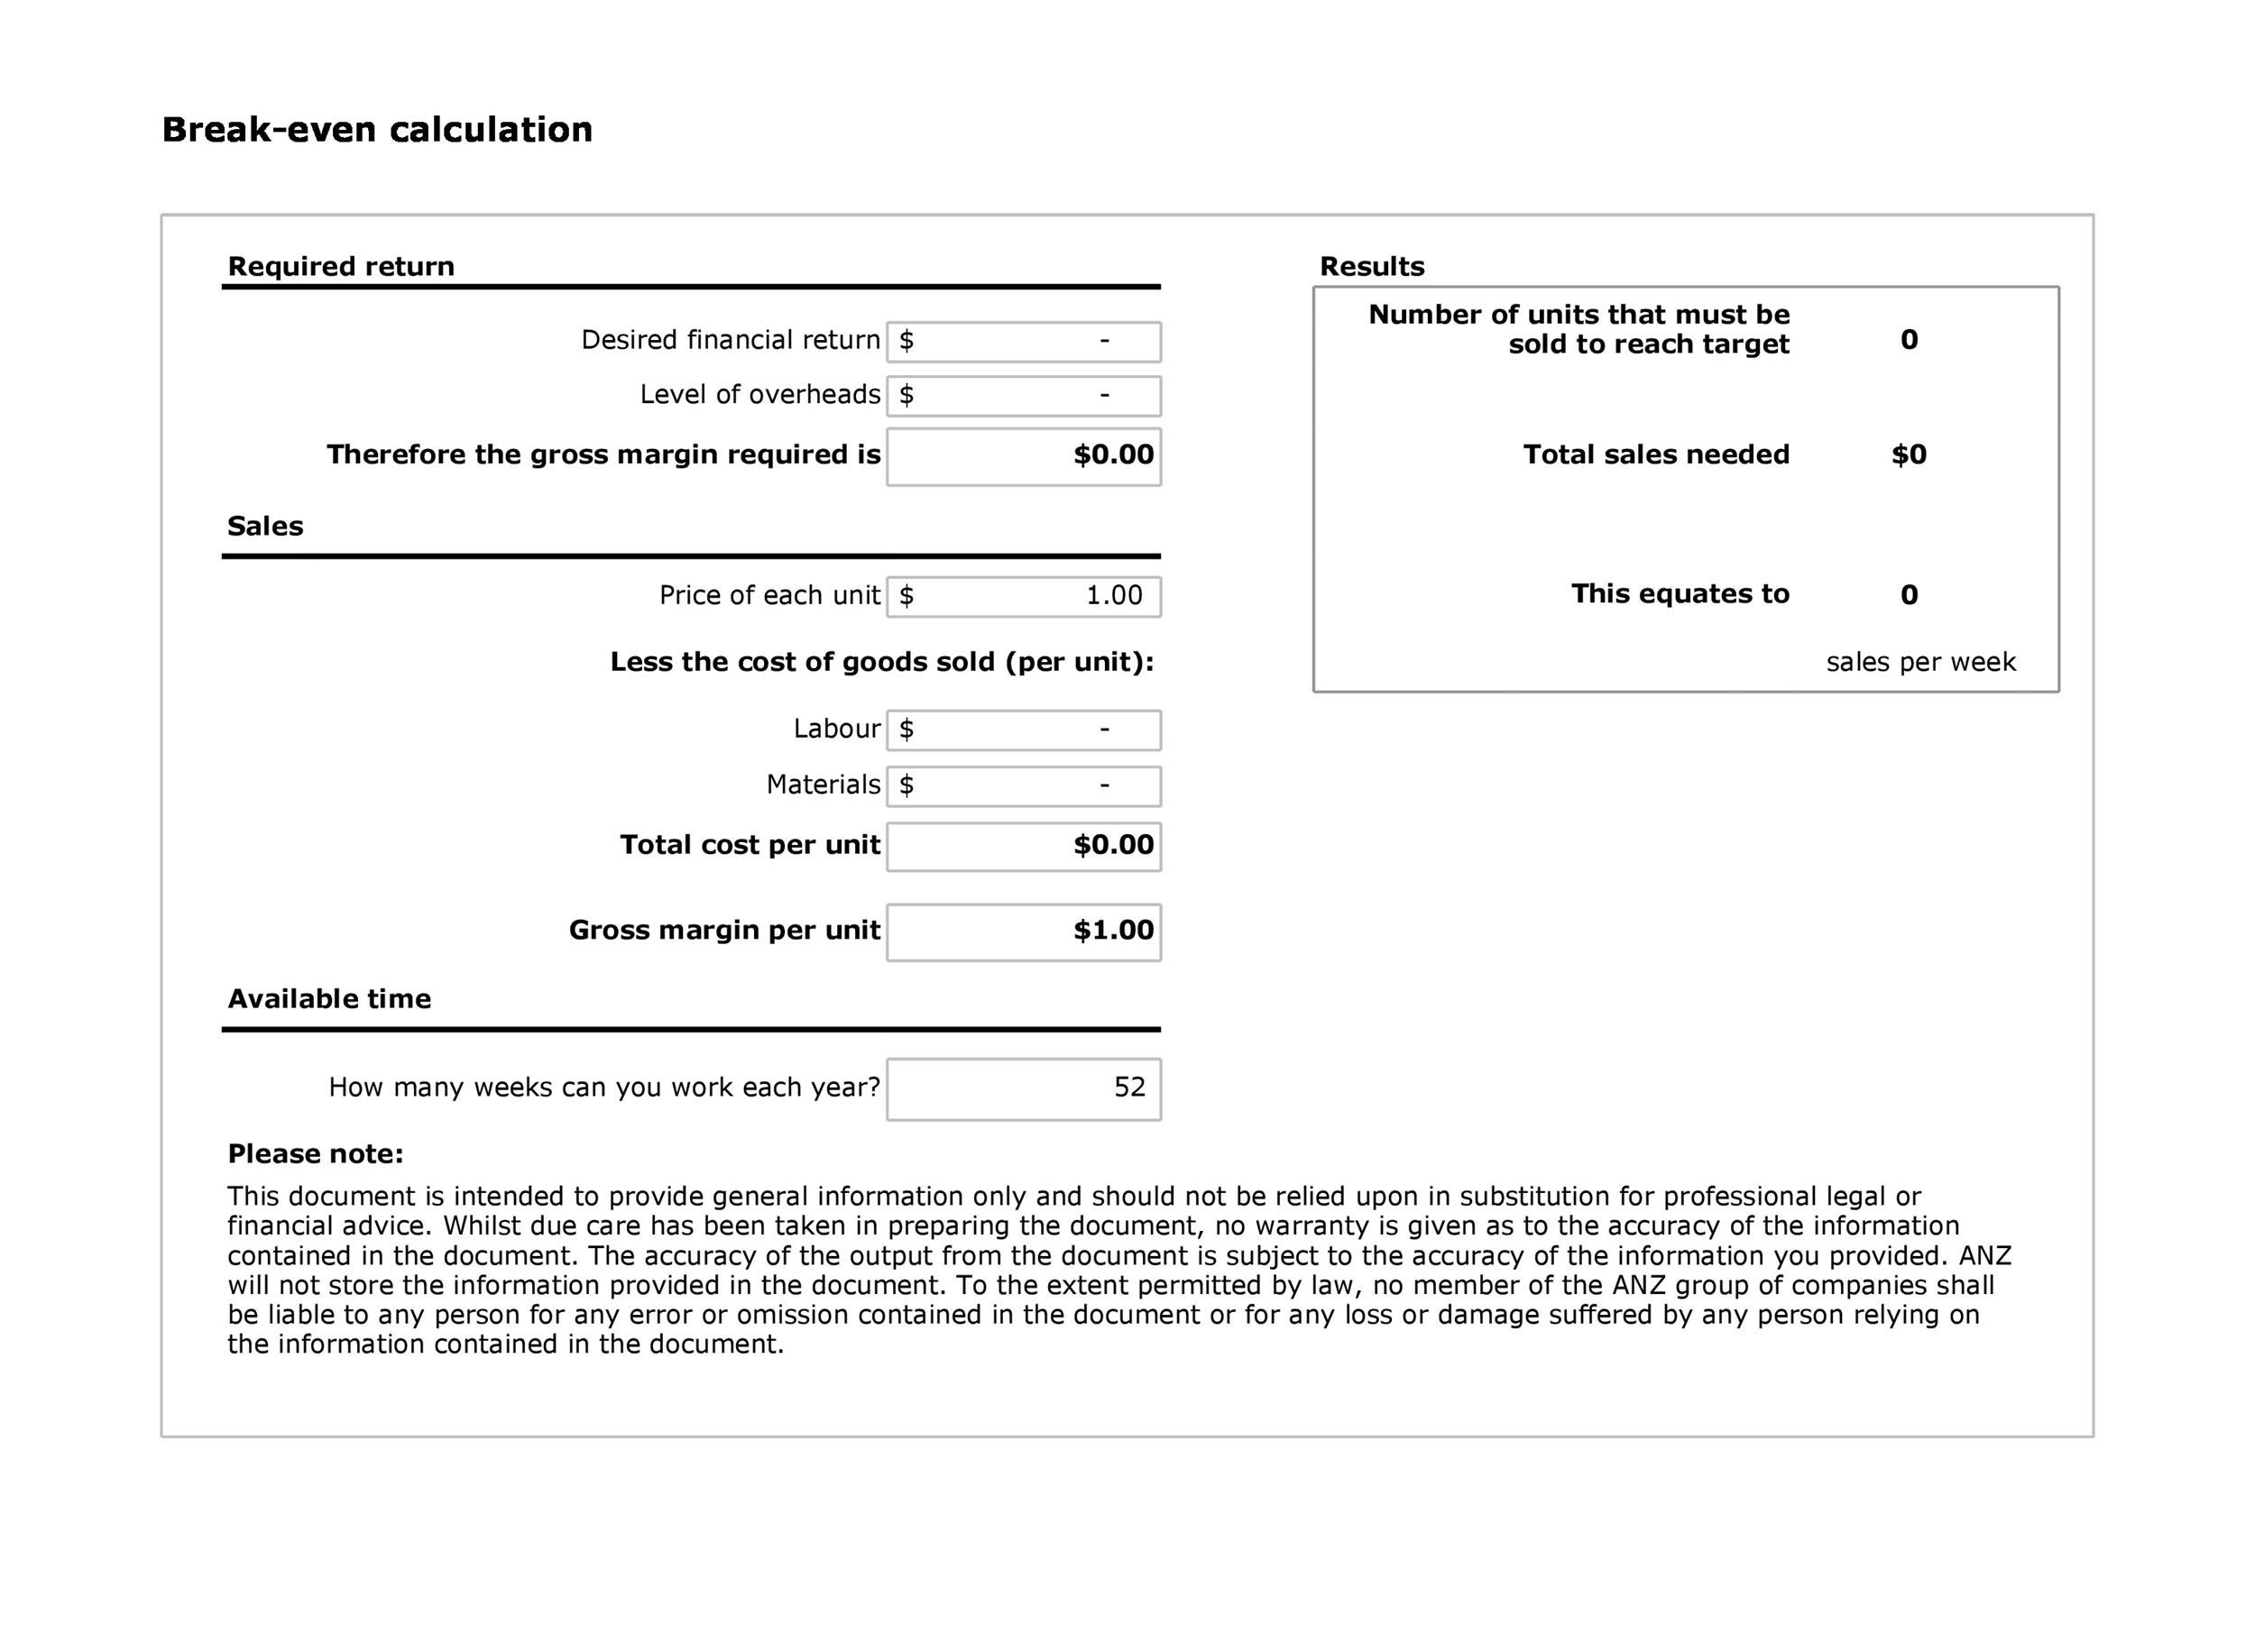
- Price of each unit
- Cost of each unit
- Fixed costs
- Variable costs
When you’re trying to establish your BEP, remember that it isn’t a standard value. It’s more of an estimate which will provide insight into how profits and losses will change. These changes happen as your sales rise and fall.
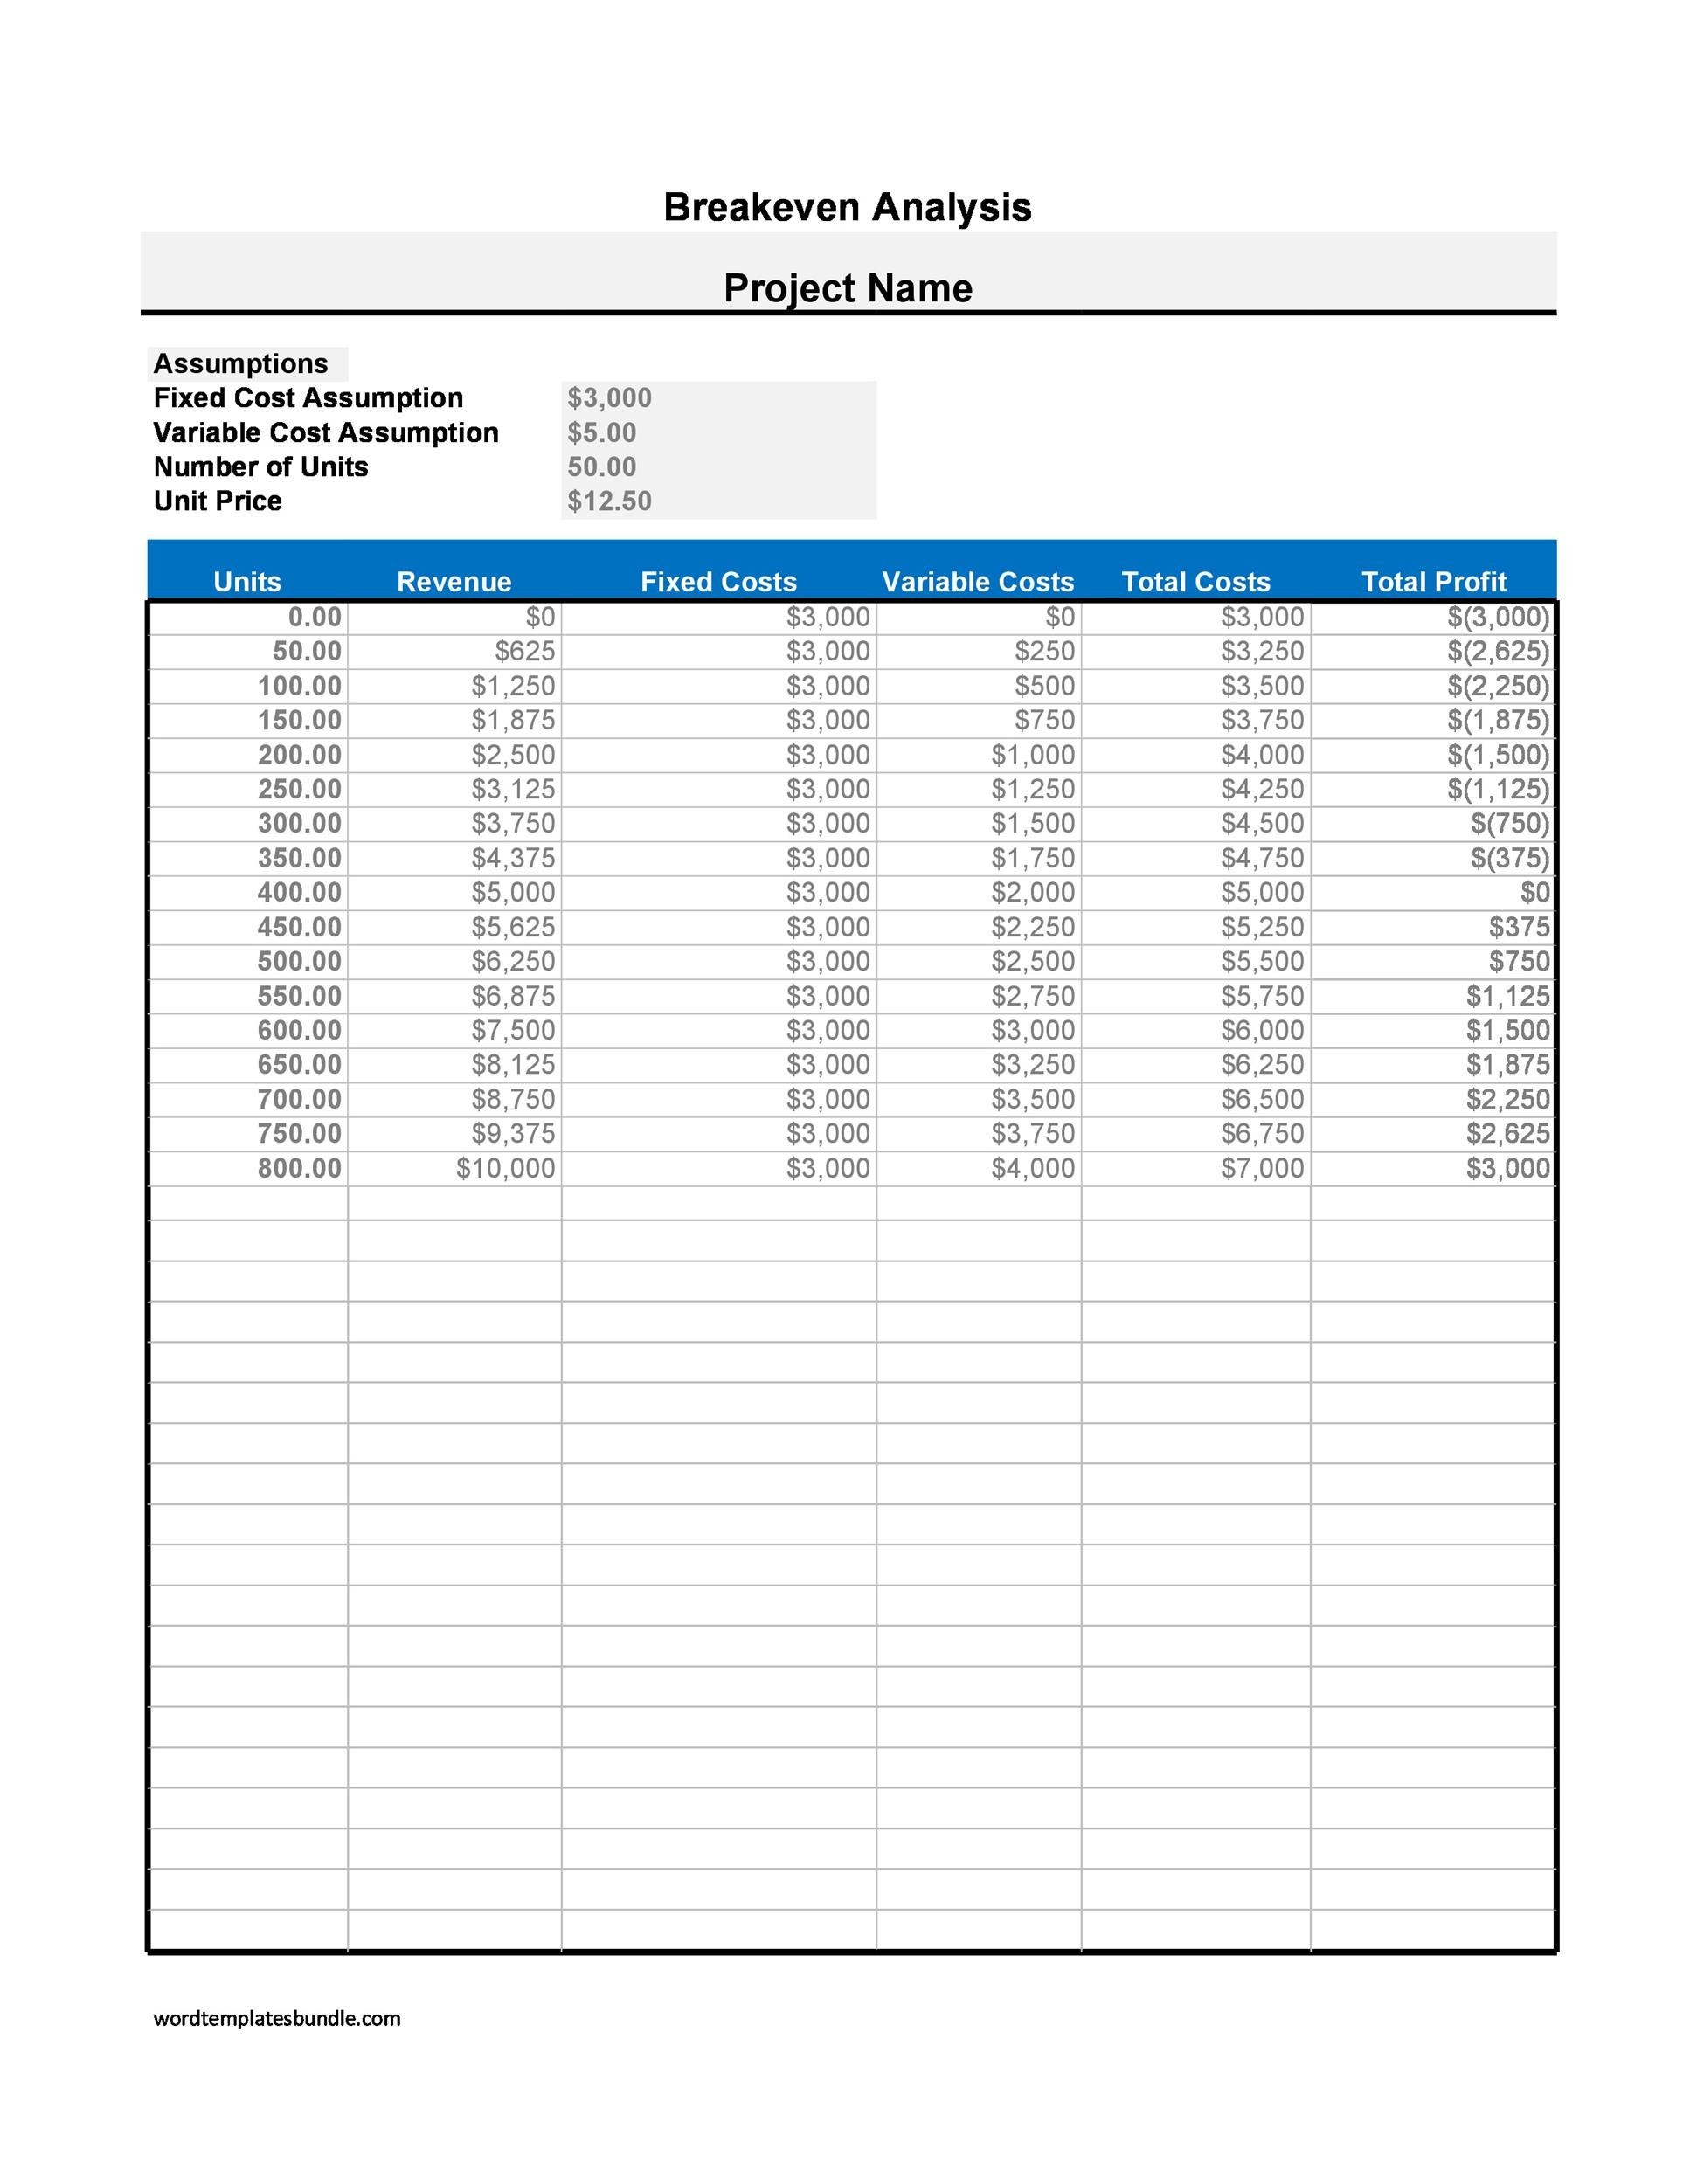
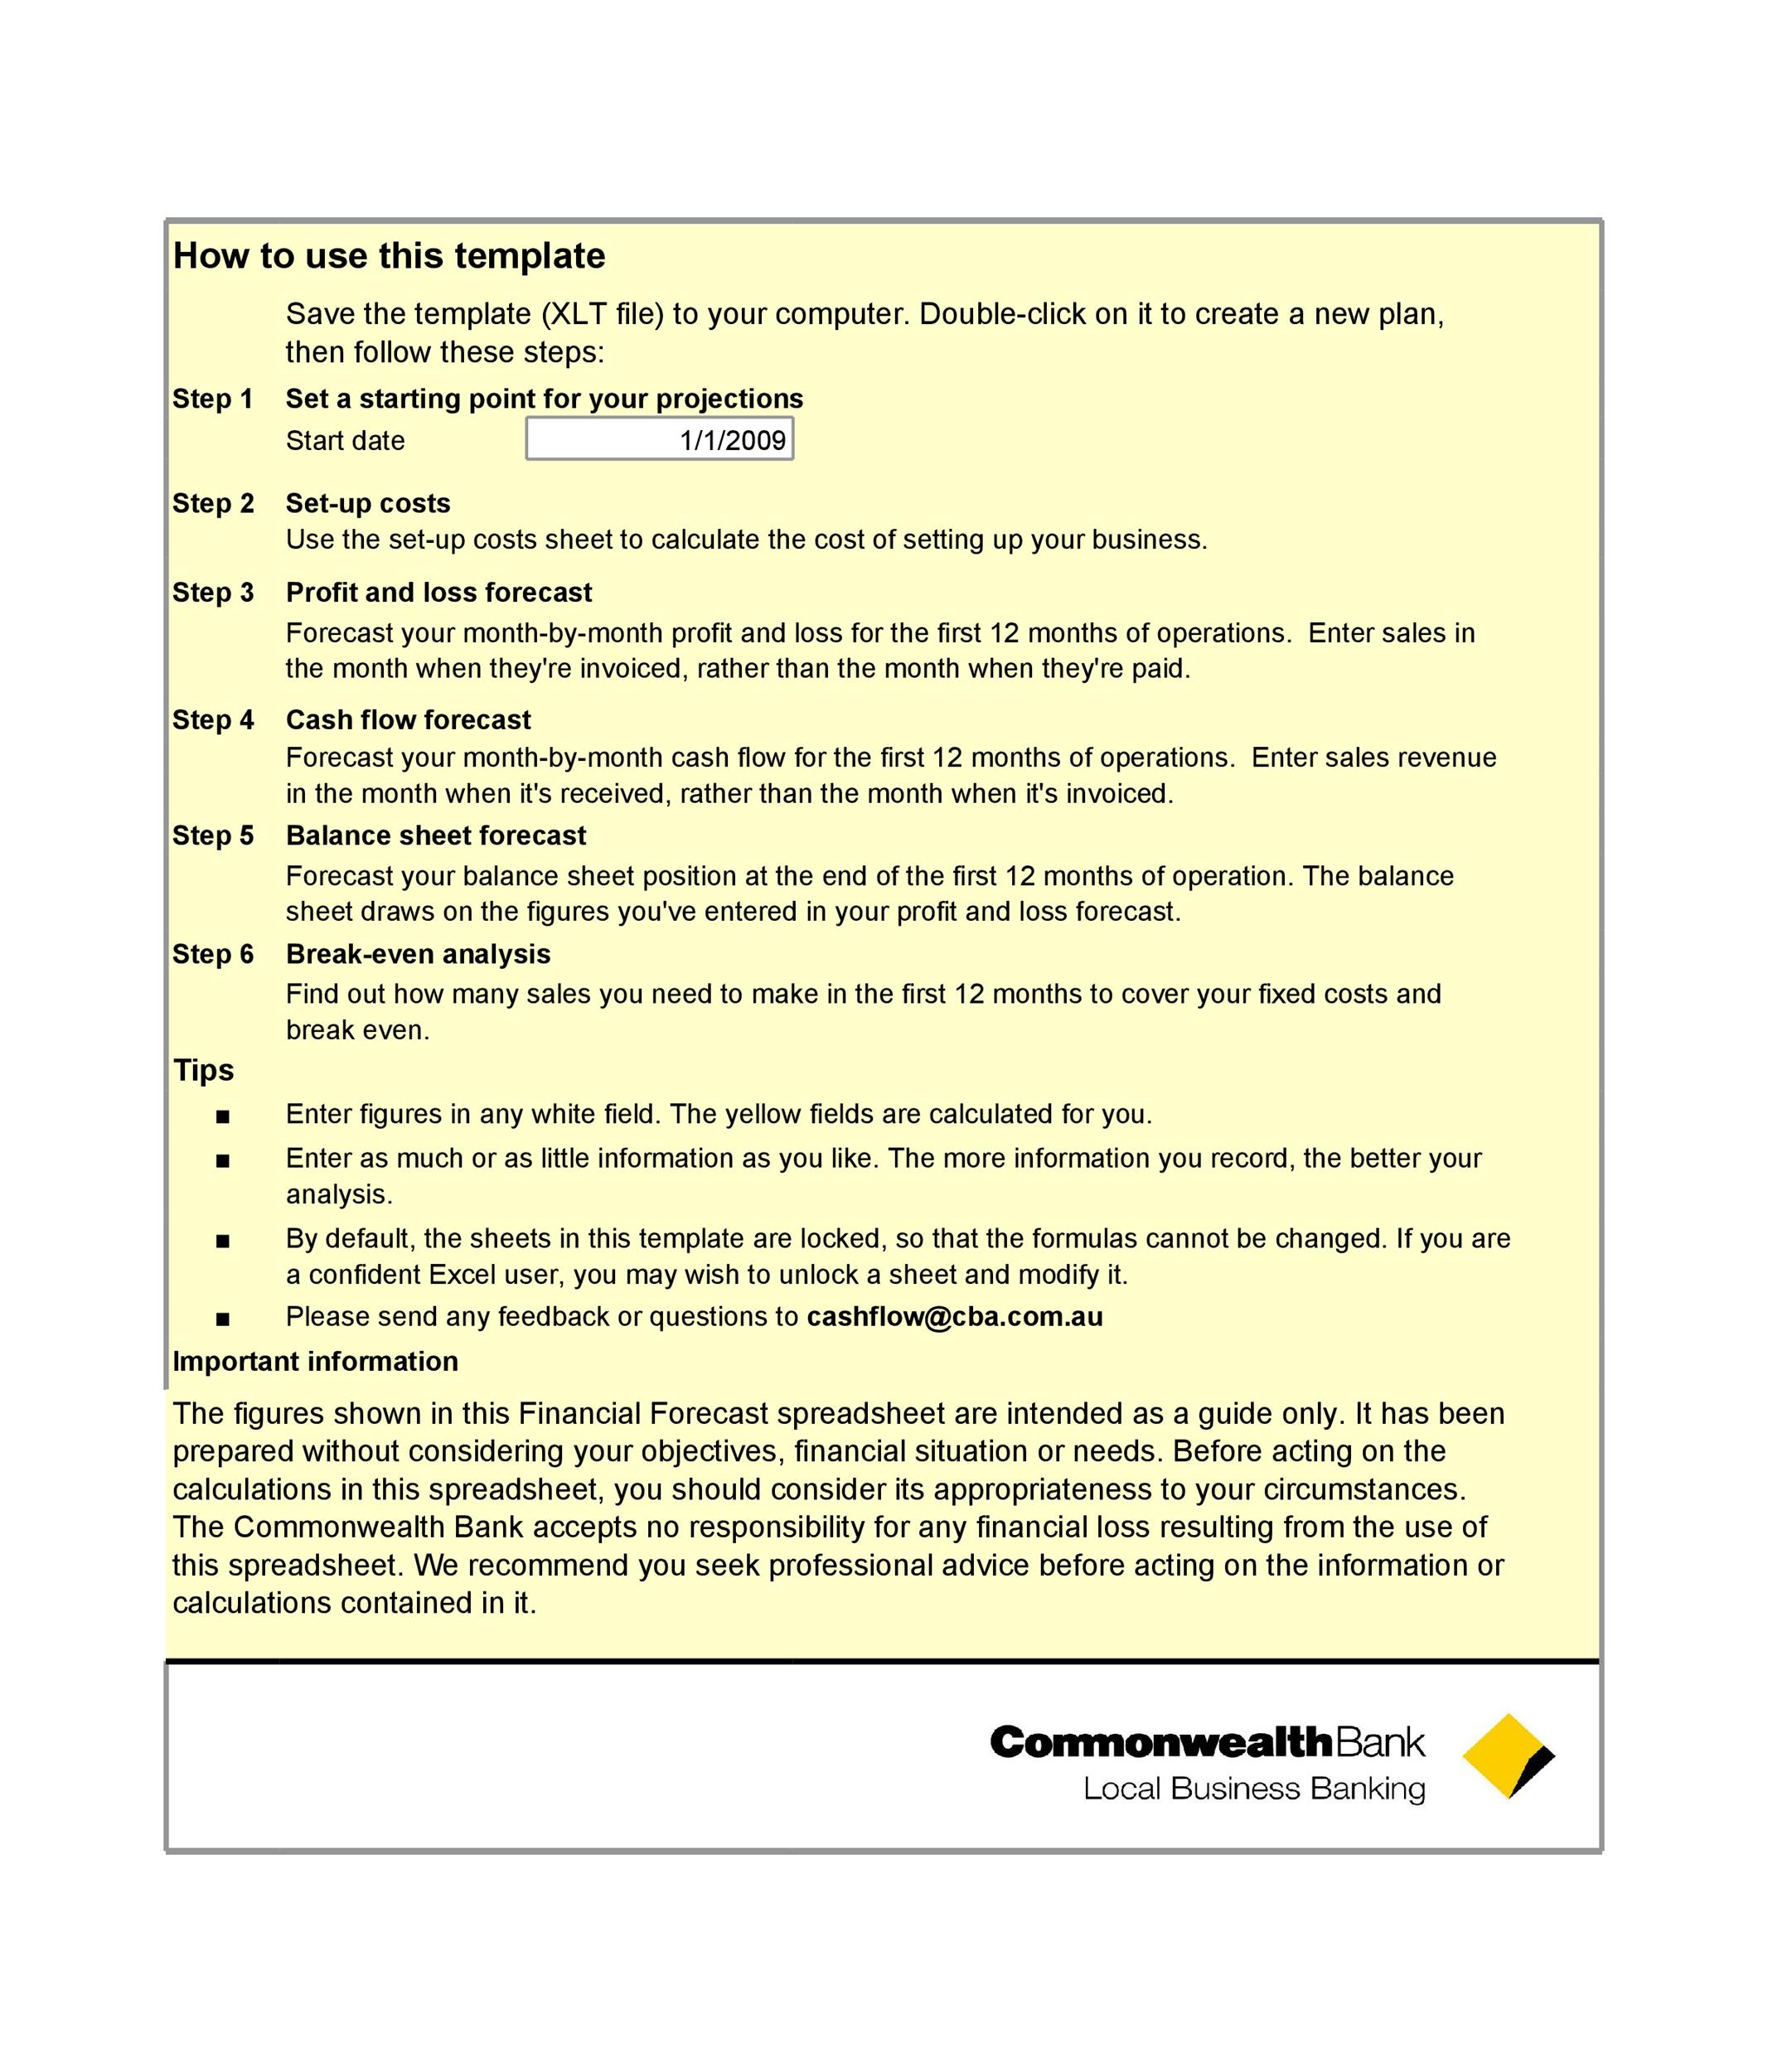
If you want to perform your analysis well, you need a break-even analysis template. You’ll input all your information on it in order to come up with accurate calculations. You can easily create a break-even analysis in Excel.
Break Even Analysis Excel
Here are some general steps and tips to guide you:
- First, you need to create some tables. You need these to record all the costs.
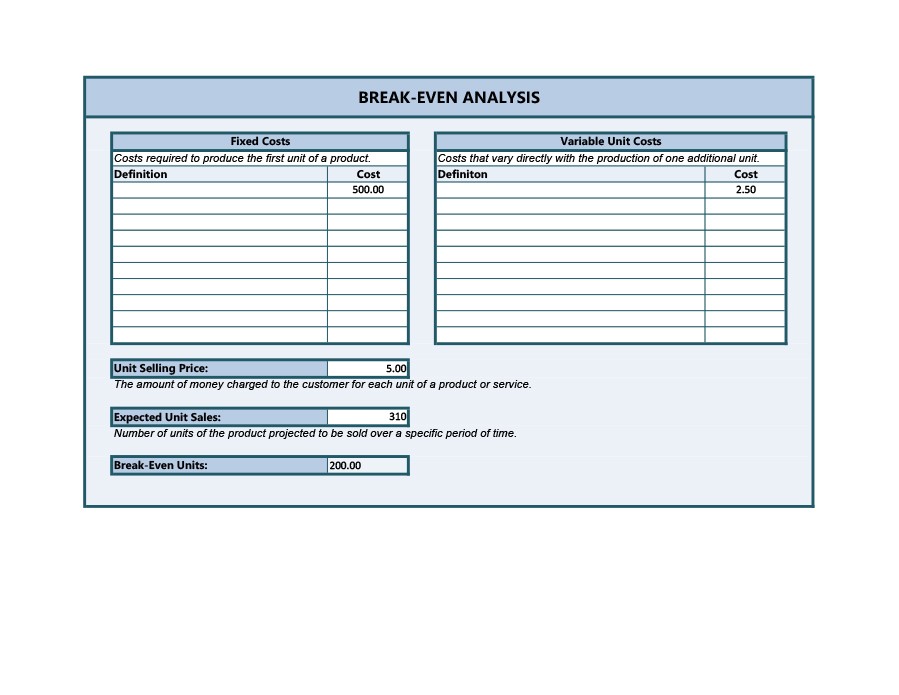
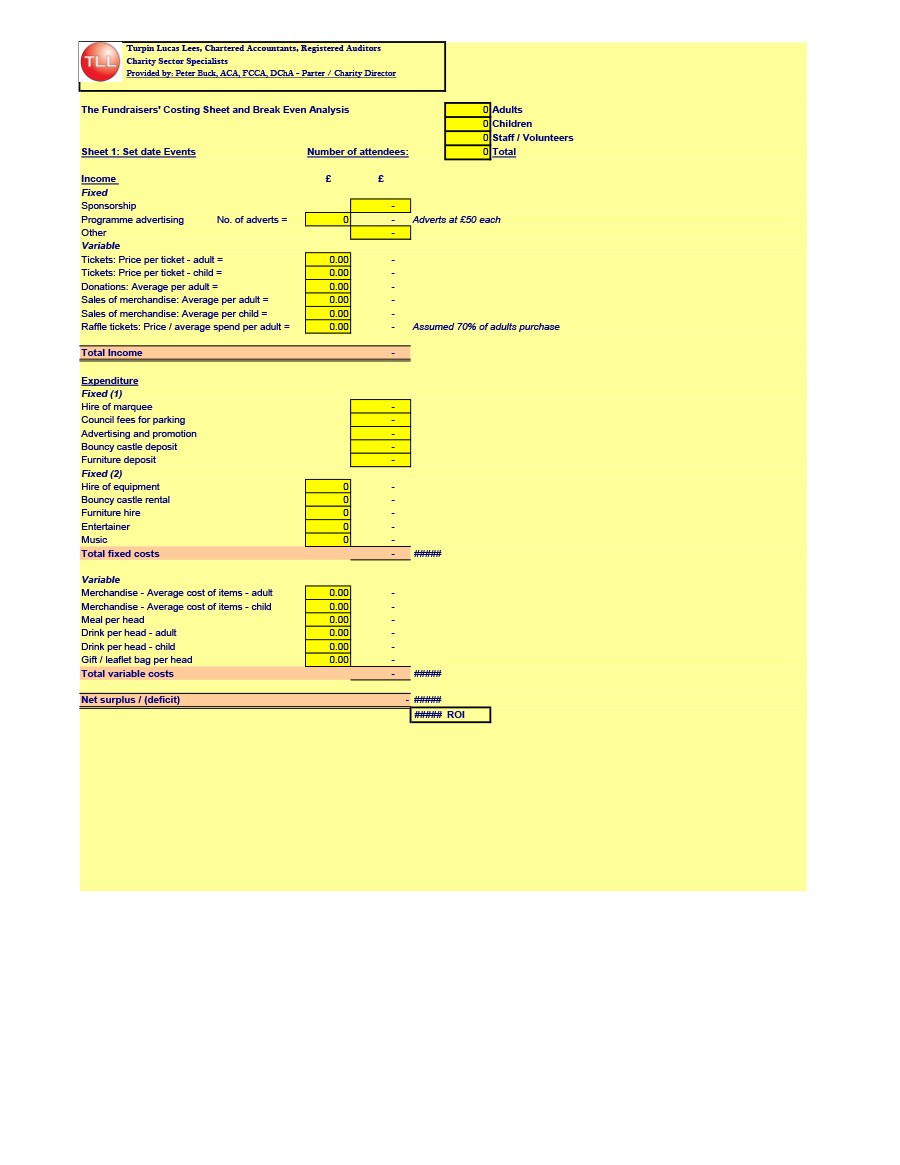
- Remember that there are 2 kinds of costs – fixed and variable. Use the table feature of Excel to record all this data. This will make customization easier for you. In the program, you don’t have to make updates to the cell references.
- Create tables in 2 different sheets. One for the fixed costs and one for the variable costs. Format the table to fit the needs of your business.
- To start off, input the labels. Then make a table on the sheet. To do this, select a cell then click the “Insert” tab. Click on the “Table” found in the Tables group, tick the “My Table Has Headers” option then click on “OK.” You can use the tables you create to record the costs.
- Create a sheet for your BEP analysis and give the sheet its own name. You can use the color fill option to indicate input cells. This will make it easier for you but it’s not required. Make use of this sheet to input different values.
These include the costs per unit and the number of units sold. These will help you come up with the BEP. - The next thing for you to do is to create the range names. When you’ve placed your labels, come up with the range names. You’ll use these for your formulas. To do this, select the cells you need then click on the “Formulas” tab.
Click on the “Create From Selection” option found in the Defined Names group and click on “OK.” Keep on doing this for all the cells where you want to add formulas.
When you do this, Excel embeds underscore characters automatically. These characters are in between the words in the range names. - Once that’s done, it’s time to input your BEP formulas. You need to enter these formulas so you can generate your BEP value.
- When you’ve finished the last step, it’s time to enter the cost values. Go back to the tables you’ve made for costs. Input the corresponding values for the product you’re planning to launch. You can modify the tables to fit your needs.
- As you enter the values, keep in mind that the template won’t consider the period costs. So you have to make sure that the values you enter represent a single period consistently. You may enter monthly or annual costs into your tables.
- After inputting these values, the next step is to input your BEP variables. Before you can do this, you need to evaluate the costs. Then you can input your best-estimated unit price and unit sold values.
These values will help you generate your BEP. - You can also input the labels for a sales analysis. By this time, you may think you’re done with the template. You can stop here but you can also continue to enhance your analysis. In doing this, you’ll give a bigger picture for your report.
- Finally, you can finish your template. Do this when you’re sure that all the formulas are in place and are working correctly. Before you save your file, you may want to protect your formulas. You can do this by enabling protection.
- Select the cells which contain the formulas. Right-click your selection and click “Format Cells.” Click on the “Protection” tab, tick “Locked,” and click on “OK.”
- You can also protect the whole sheet. To do this, click on the Home tab. Select the Format drop-down menu in the Cells group and choose “Protect Sheet.” In the dialogue box, uncheck the “Select Locked Cells” option.
In doing this, the protection will guide you to input the cells. Click on “OK” and you can even add a password for the file if you prefer. - If you’ve made a sales analysis sheet, you can also protect it. Do so by repeating all the steps for enabling protection.
The values and formulas that you input in your sheet are very important. You need to make sure they’re all correct. Do this so you’ll be able to get an accurate result for your analysis.
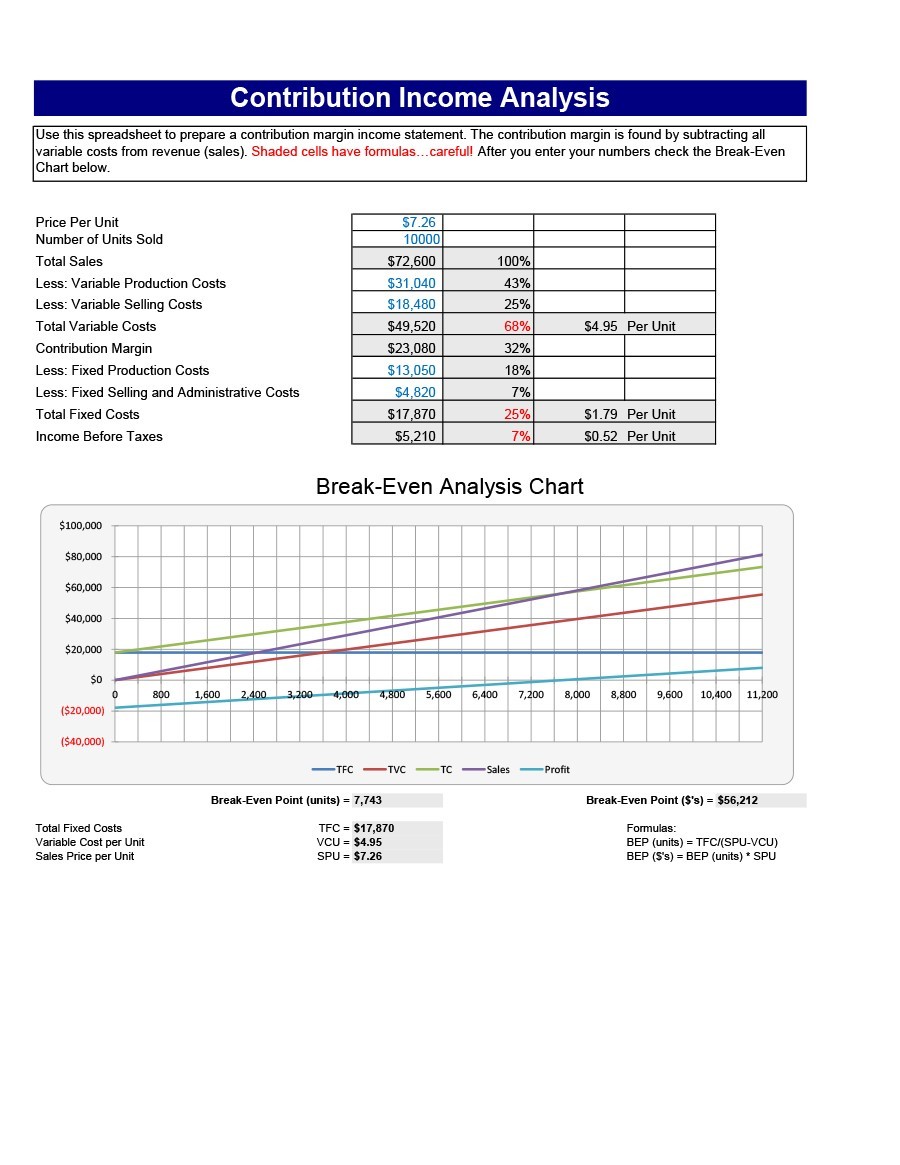
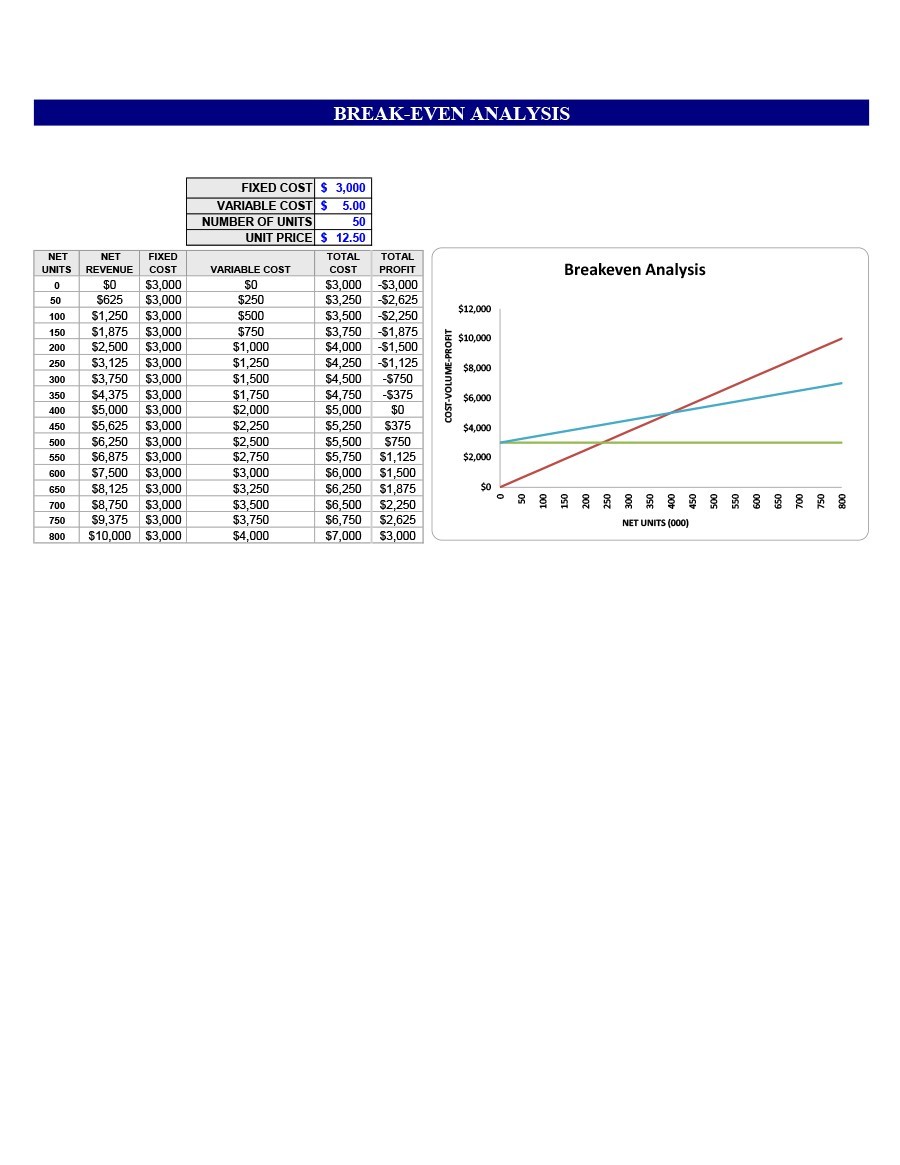
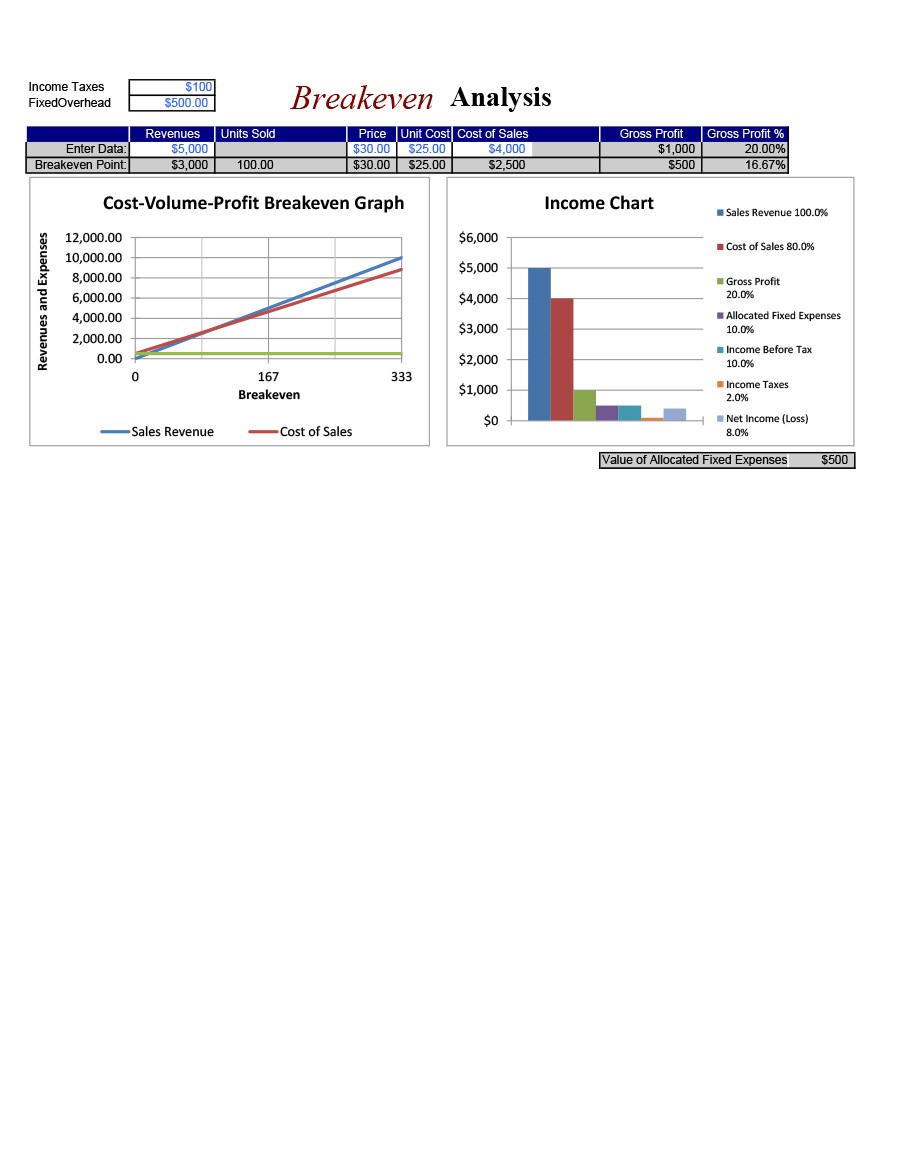
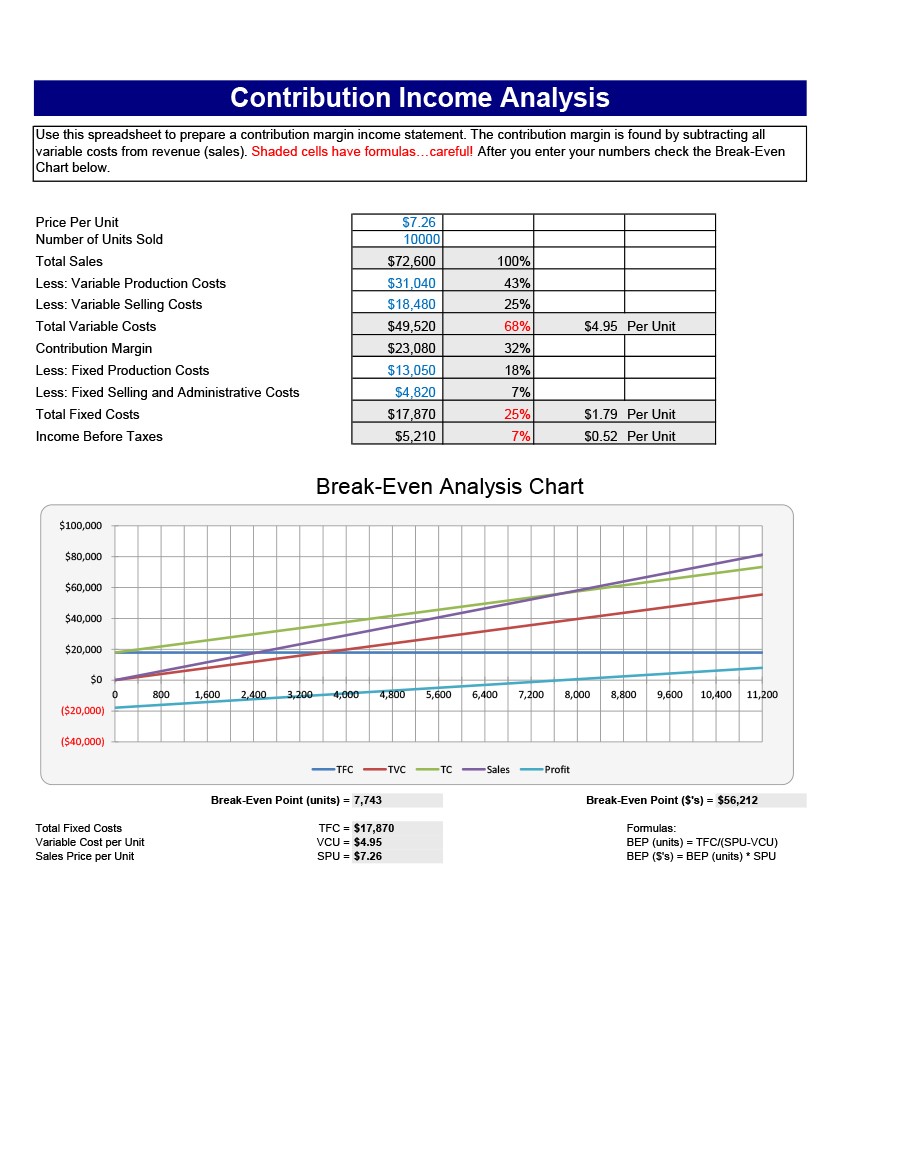
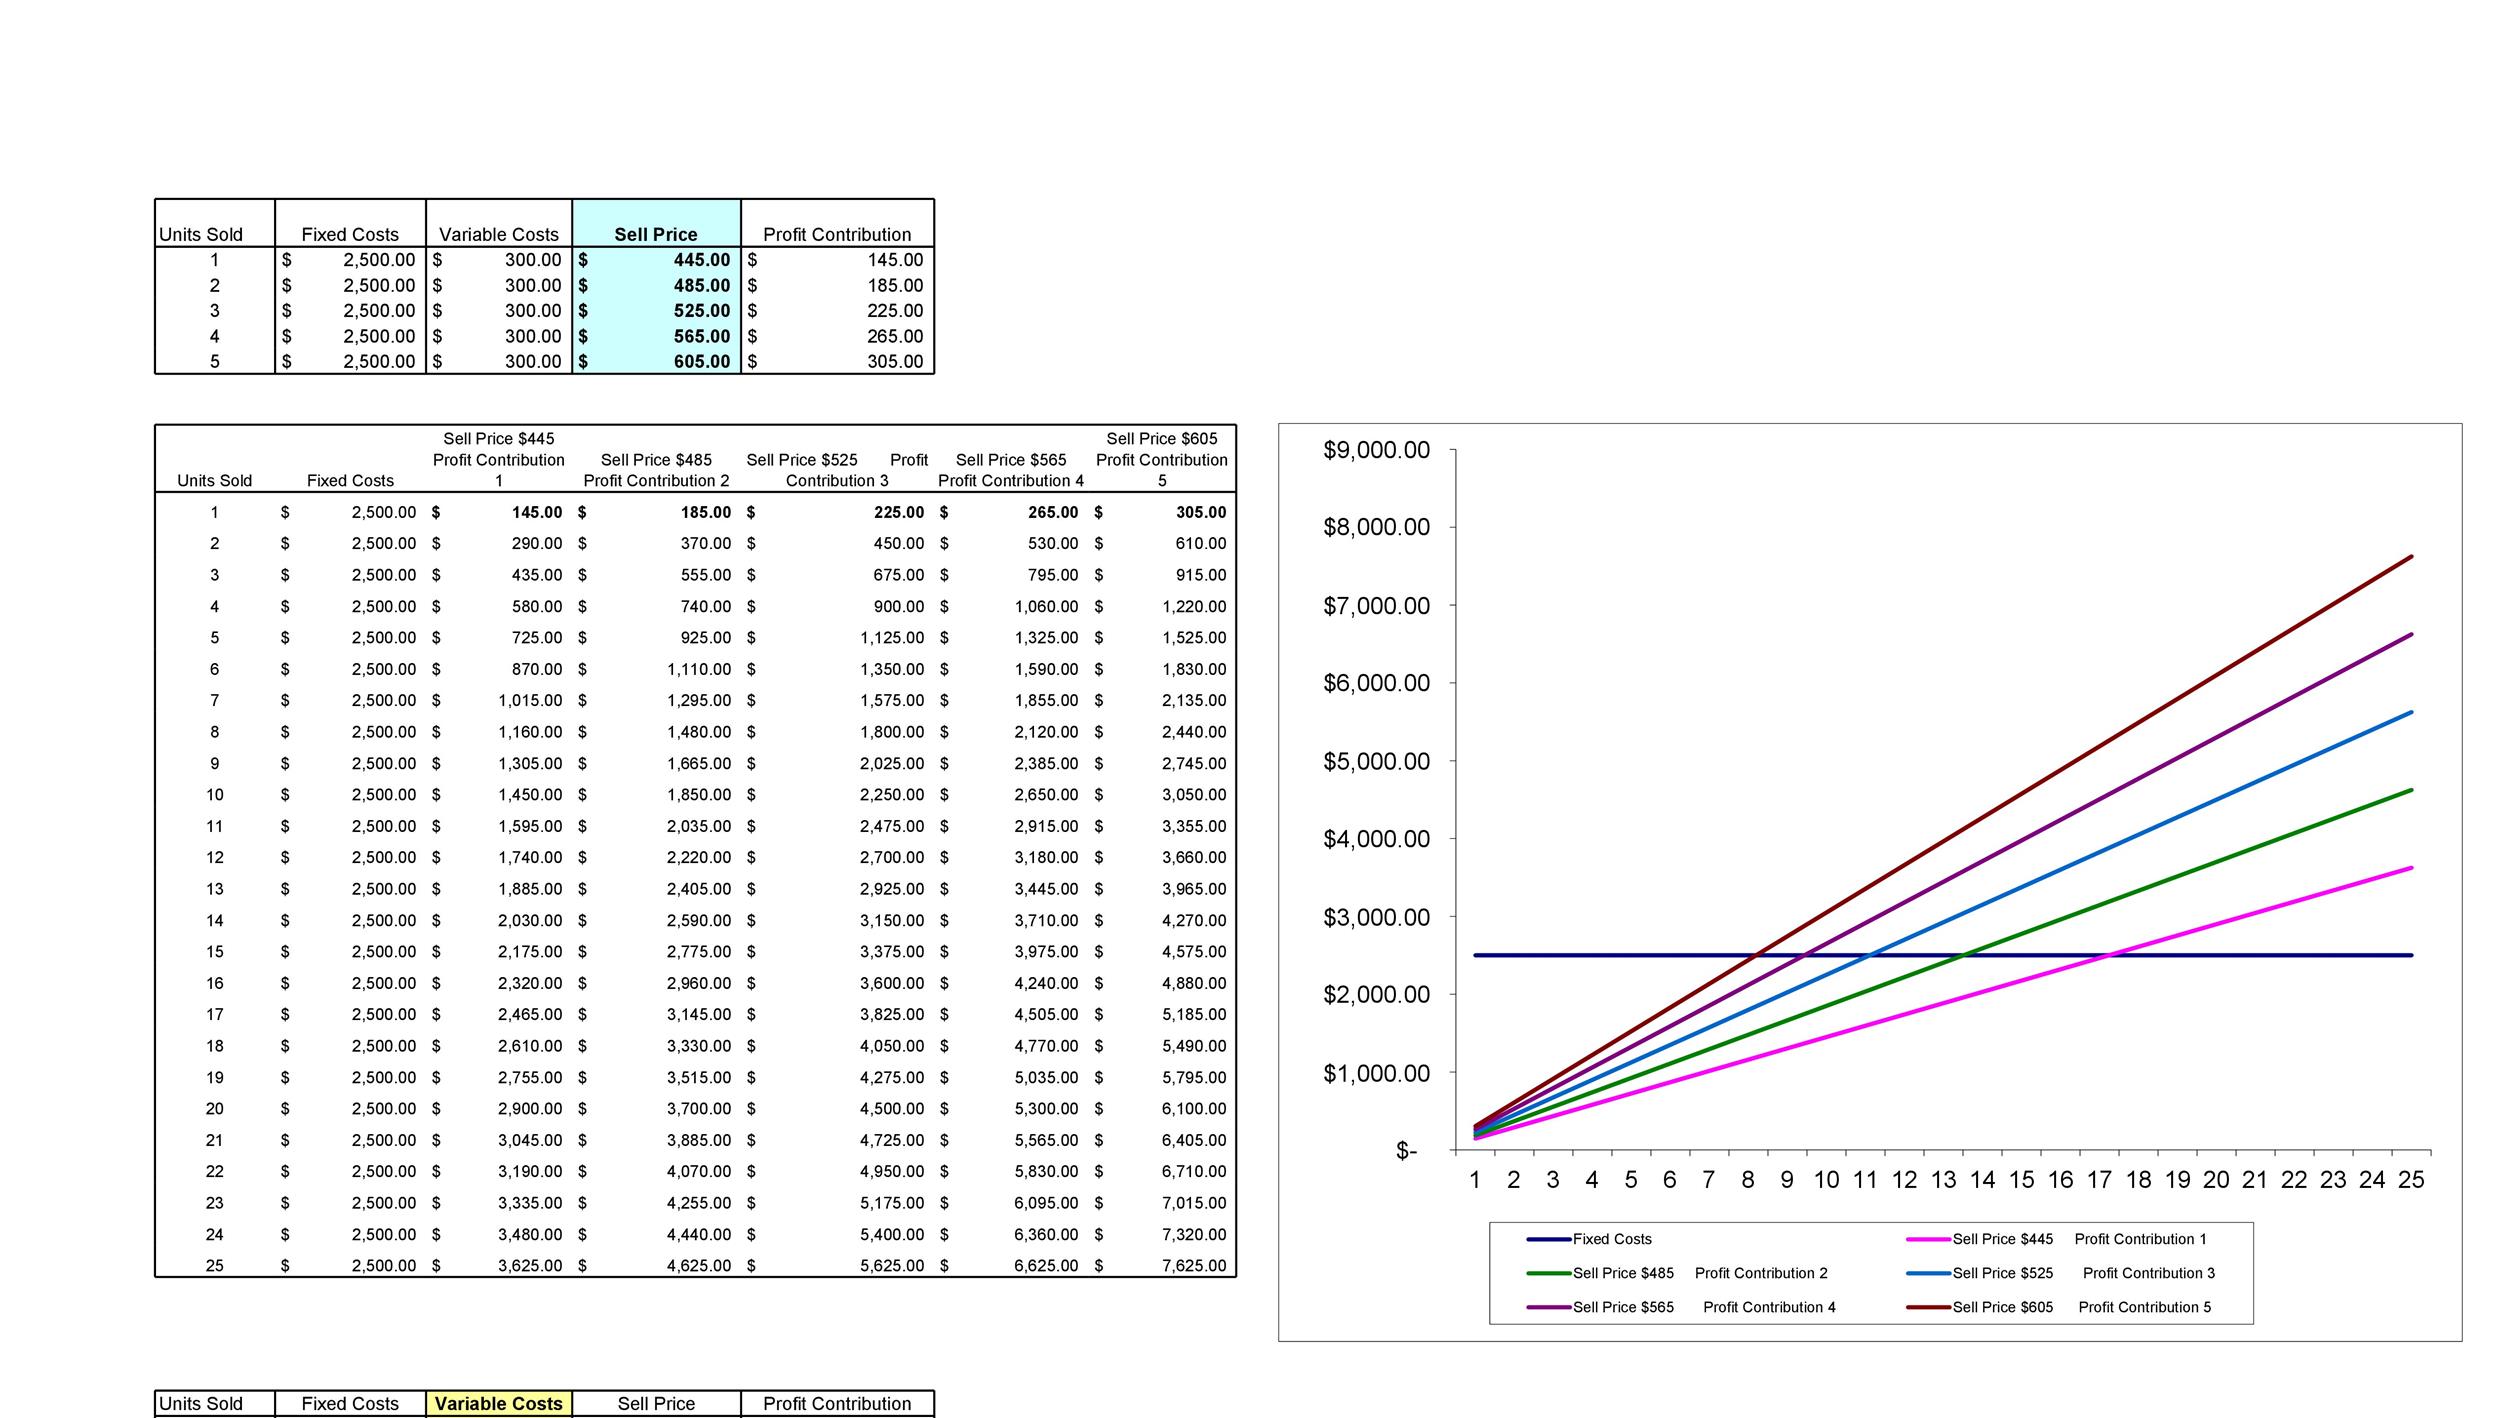
Aside from tables, you can also use a grid to analyze the information. Plot the values in the grid and interpret it accordingly. You’ll be able to see if your BEP is high or low. Then, you can determine whether you need to increase or decrease the prices of your products.
If you increase your prices, it will reduce your BEP. But if you decrease your prices, it will raise your BEP. Analyzing the data in a graph will also provide you with insight for you to make good decisions.
When you’re done with all the templates, make sure to save your work. You can save a blank template which contains all the formulas already. Then you can use that template to record all your data. Once you’re done, save the file with a different file name.
If you want to generate a new BEP, modify any of the values you’ve entered. If you want to keep the modification, save the file with a different file name again. Otherwise, just exit the program without saving the changes.
Break Even Spreadsheet Templates
Completing the break-even analysis template
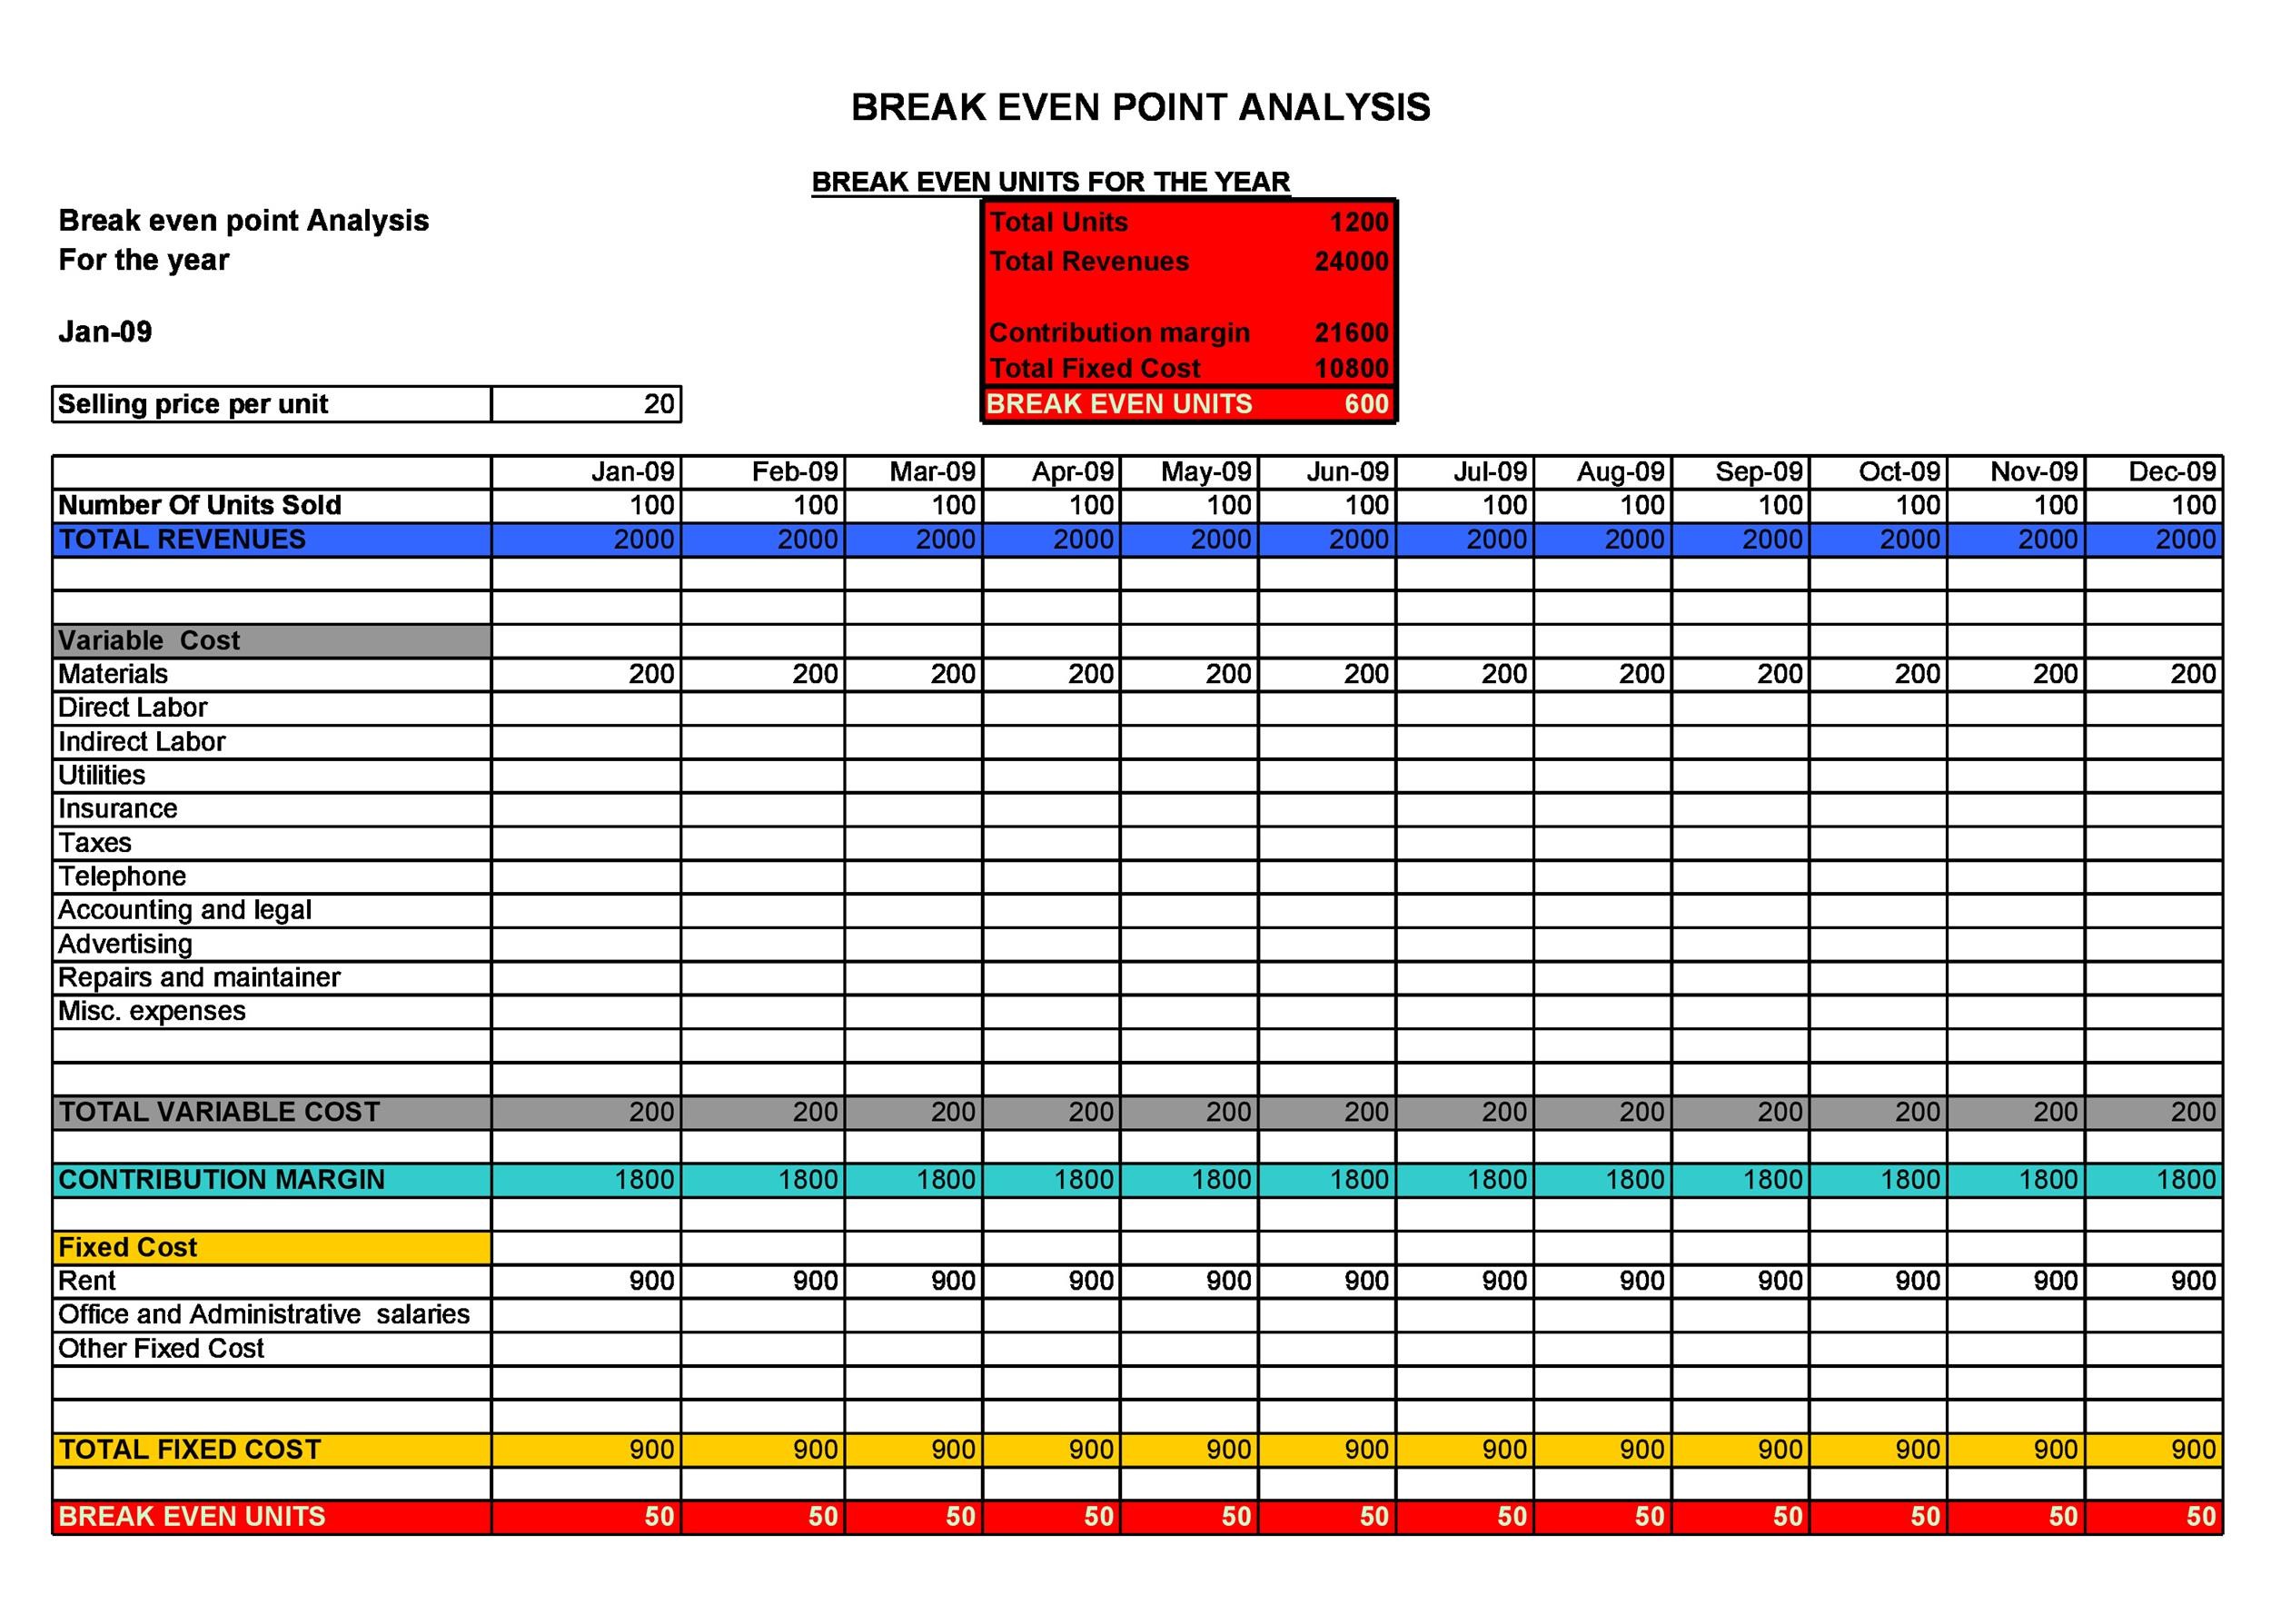
A break-even spreadsheet can help you out with your business. You can use it to establish the scenarios your company must do in order to become profitable. One of the most important uses of such an analysis is to be able to see different scenarios.
For example, if you want to hire another person for the business. How much would more sales you need to cover the employee’s salary? You may also plan to borrow money to increase your principal.
How much more money will you need to make to cover the monthly amortization payments? A lot of business owners perform break-even analyses when they’re planning something new.
It will give you an idea of what you need to reach to keep your business going.
If you’ve made a template for your analysis, then you should know how to complete it correctly. Here are some tips for you:
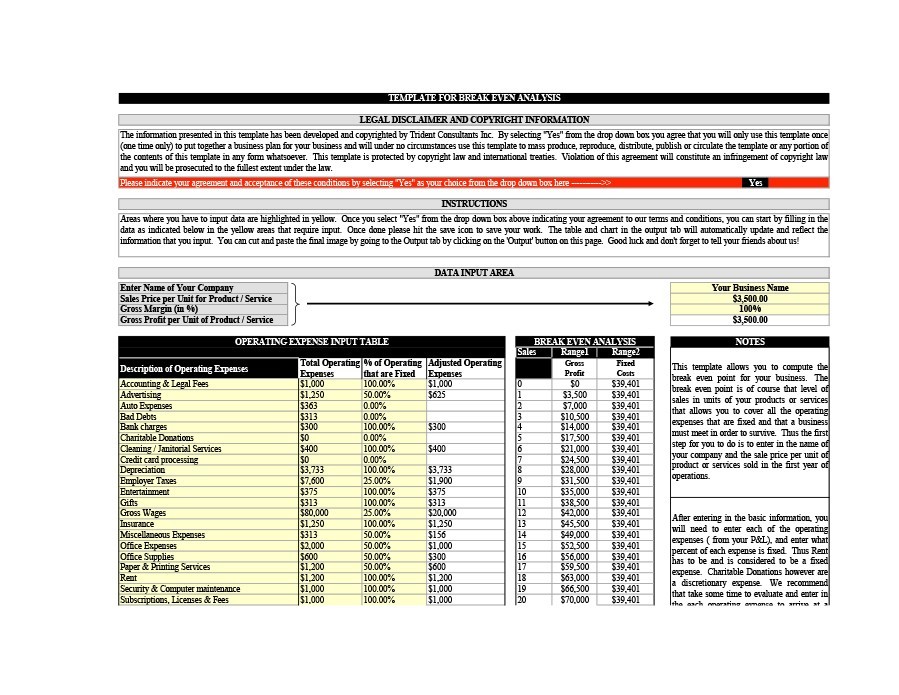
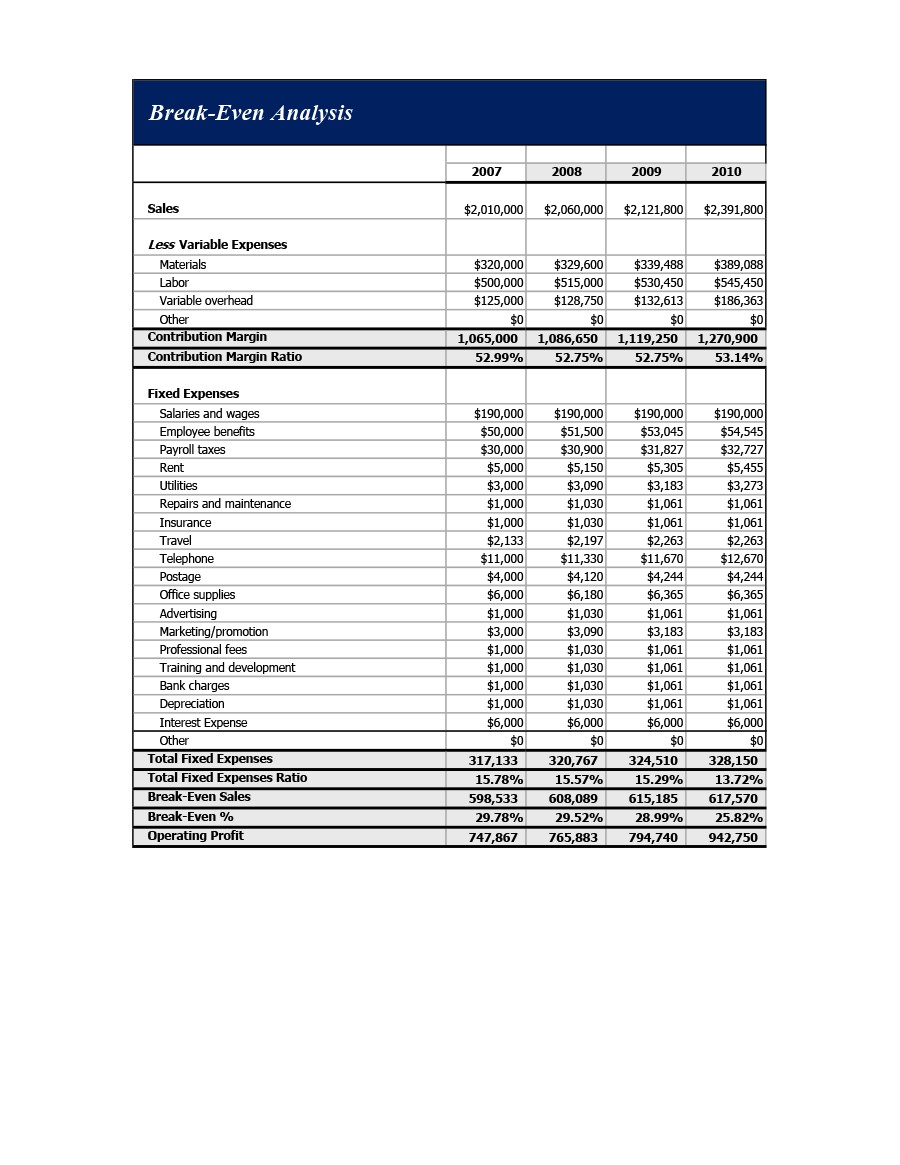
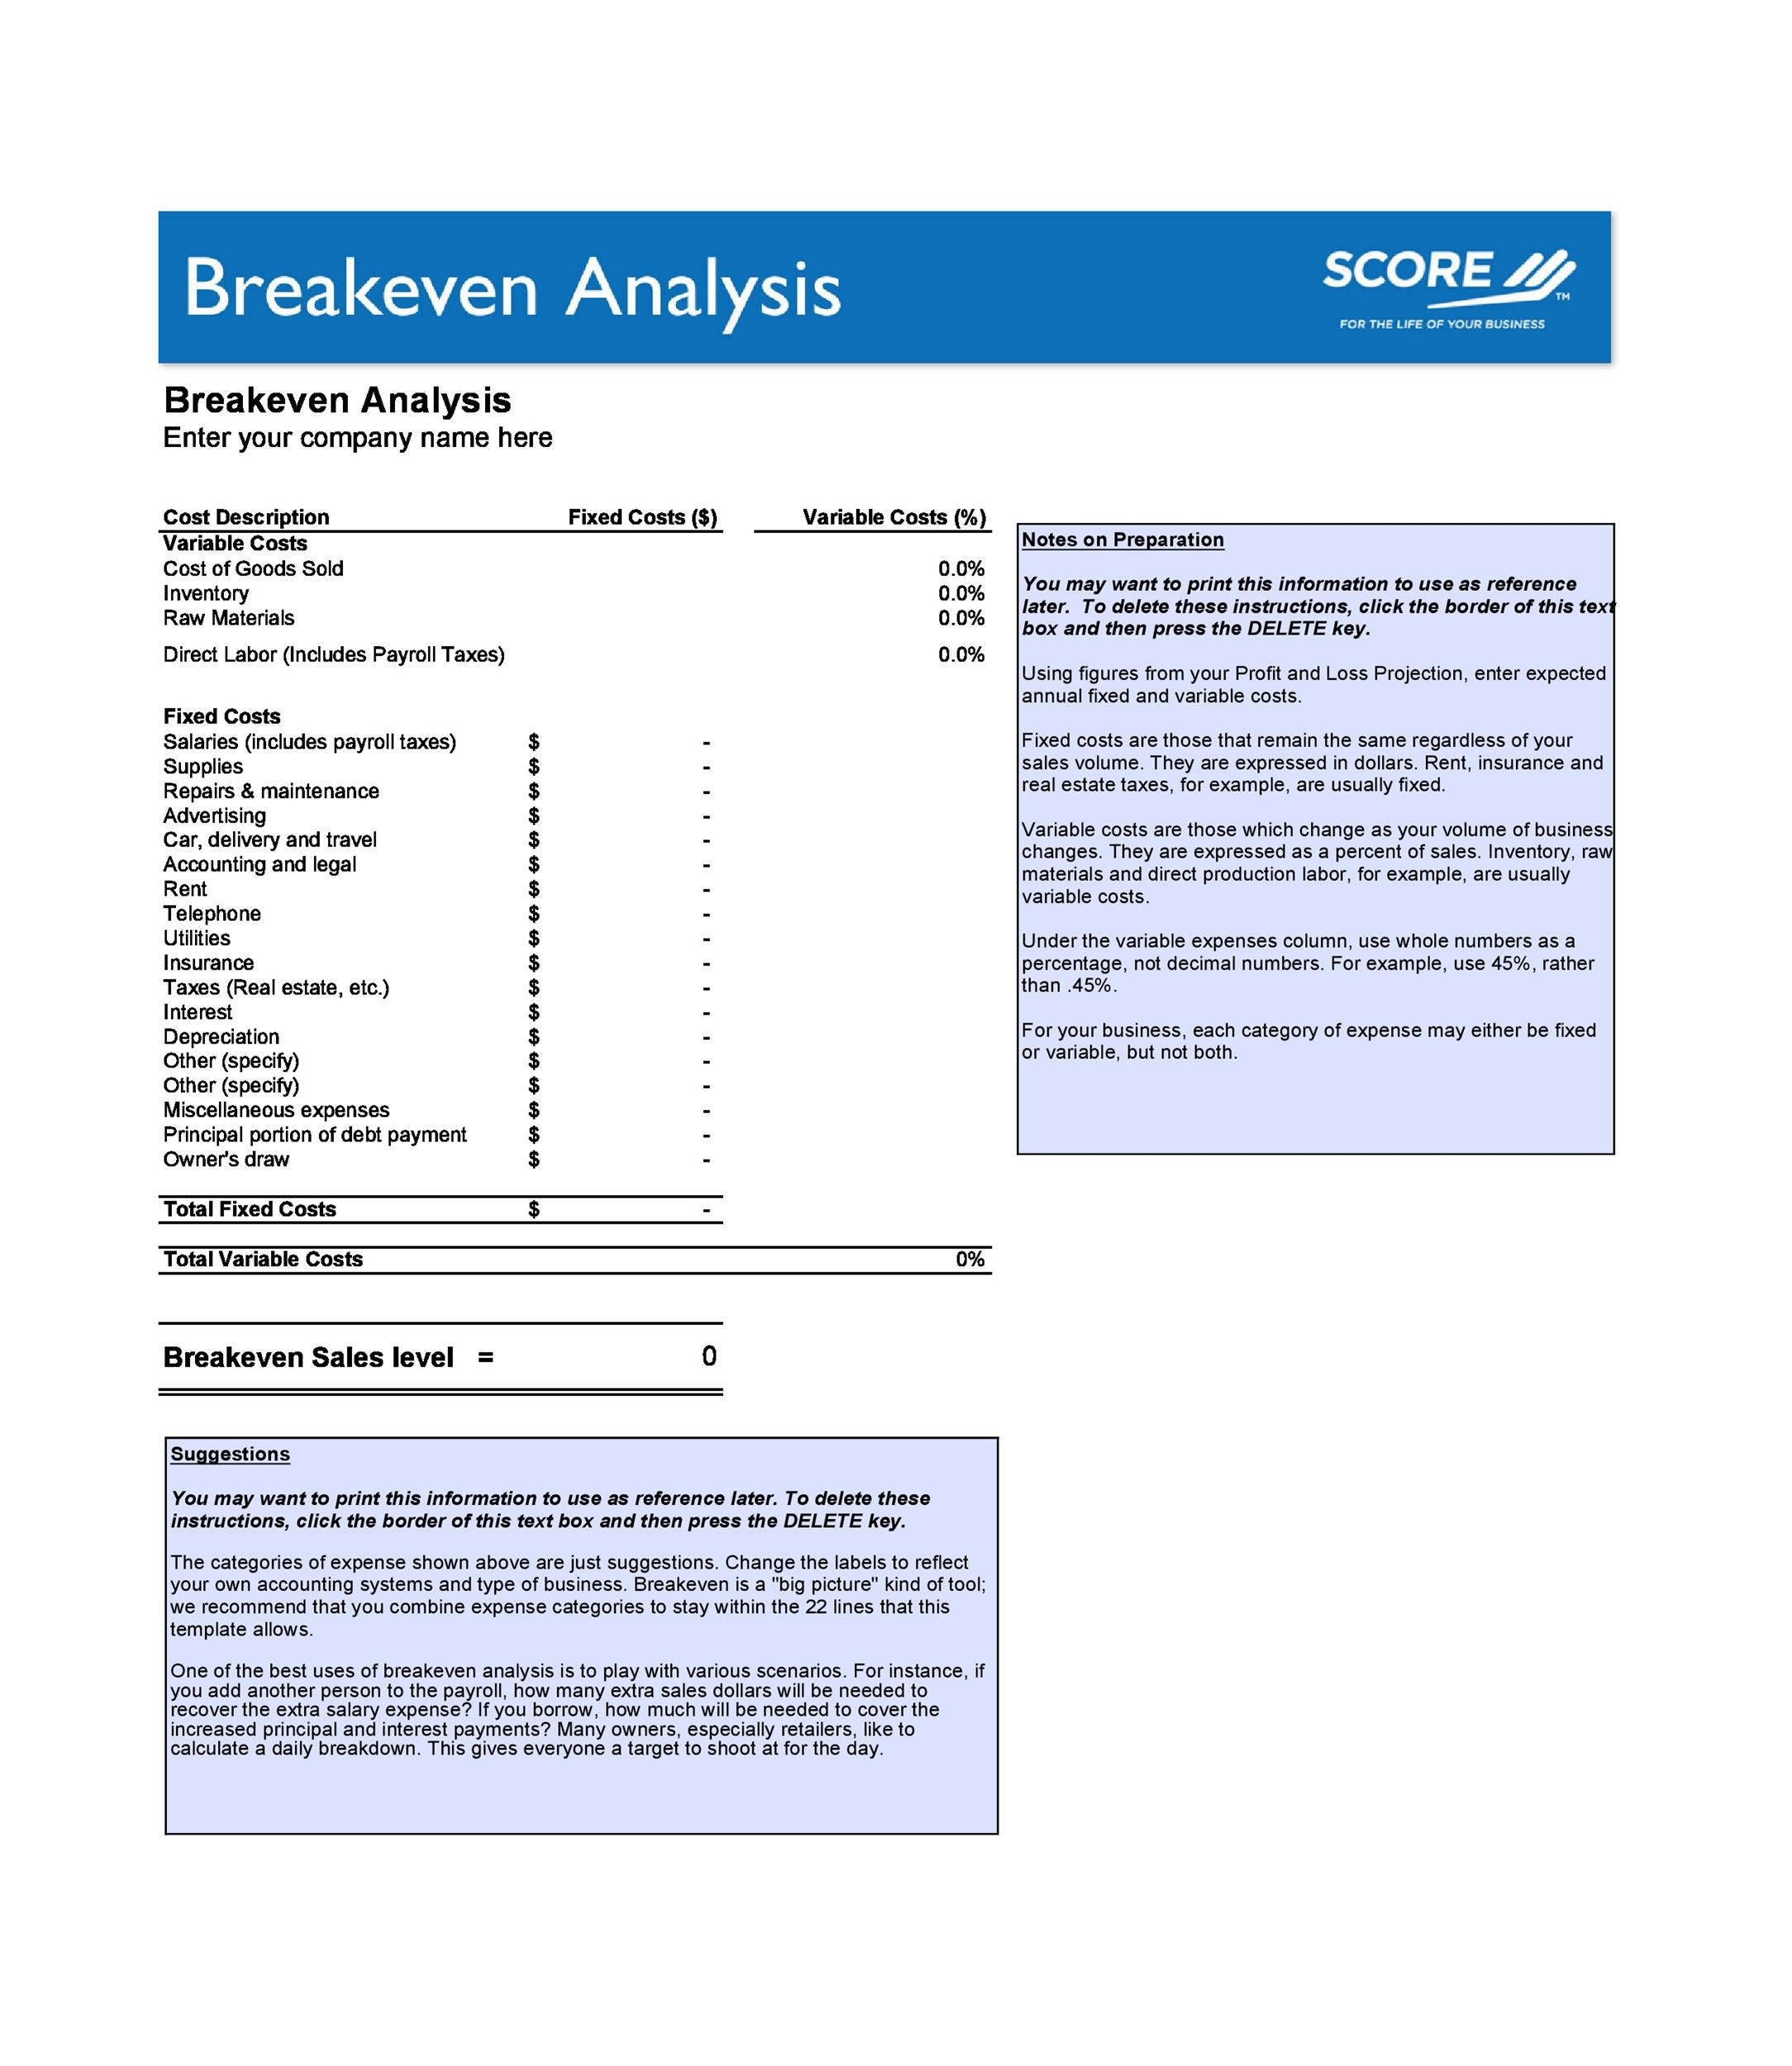
- Input all your estimated fixed and variable costs. You can get these figures from your projection of profits and losses.
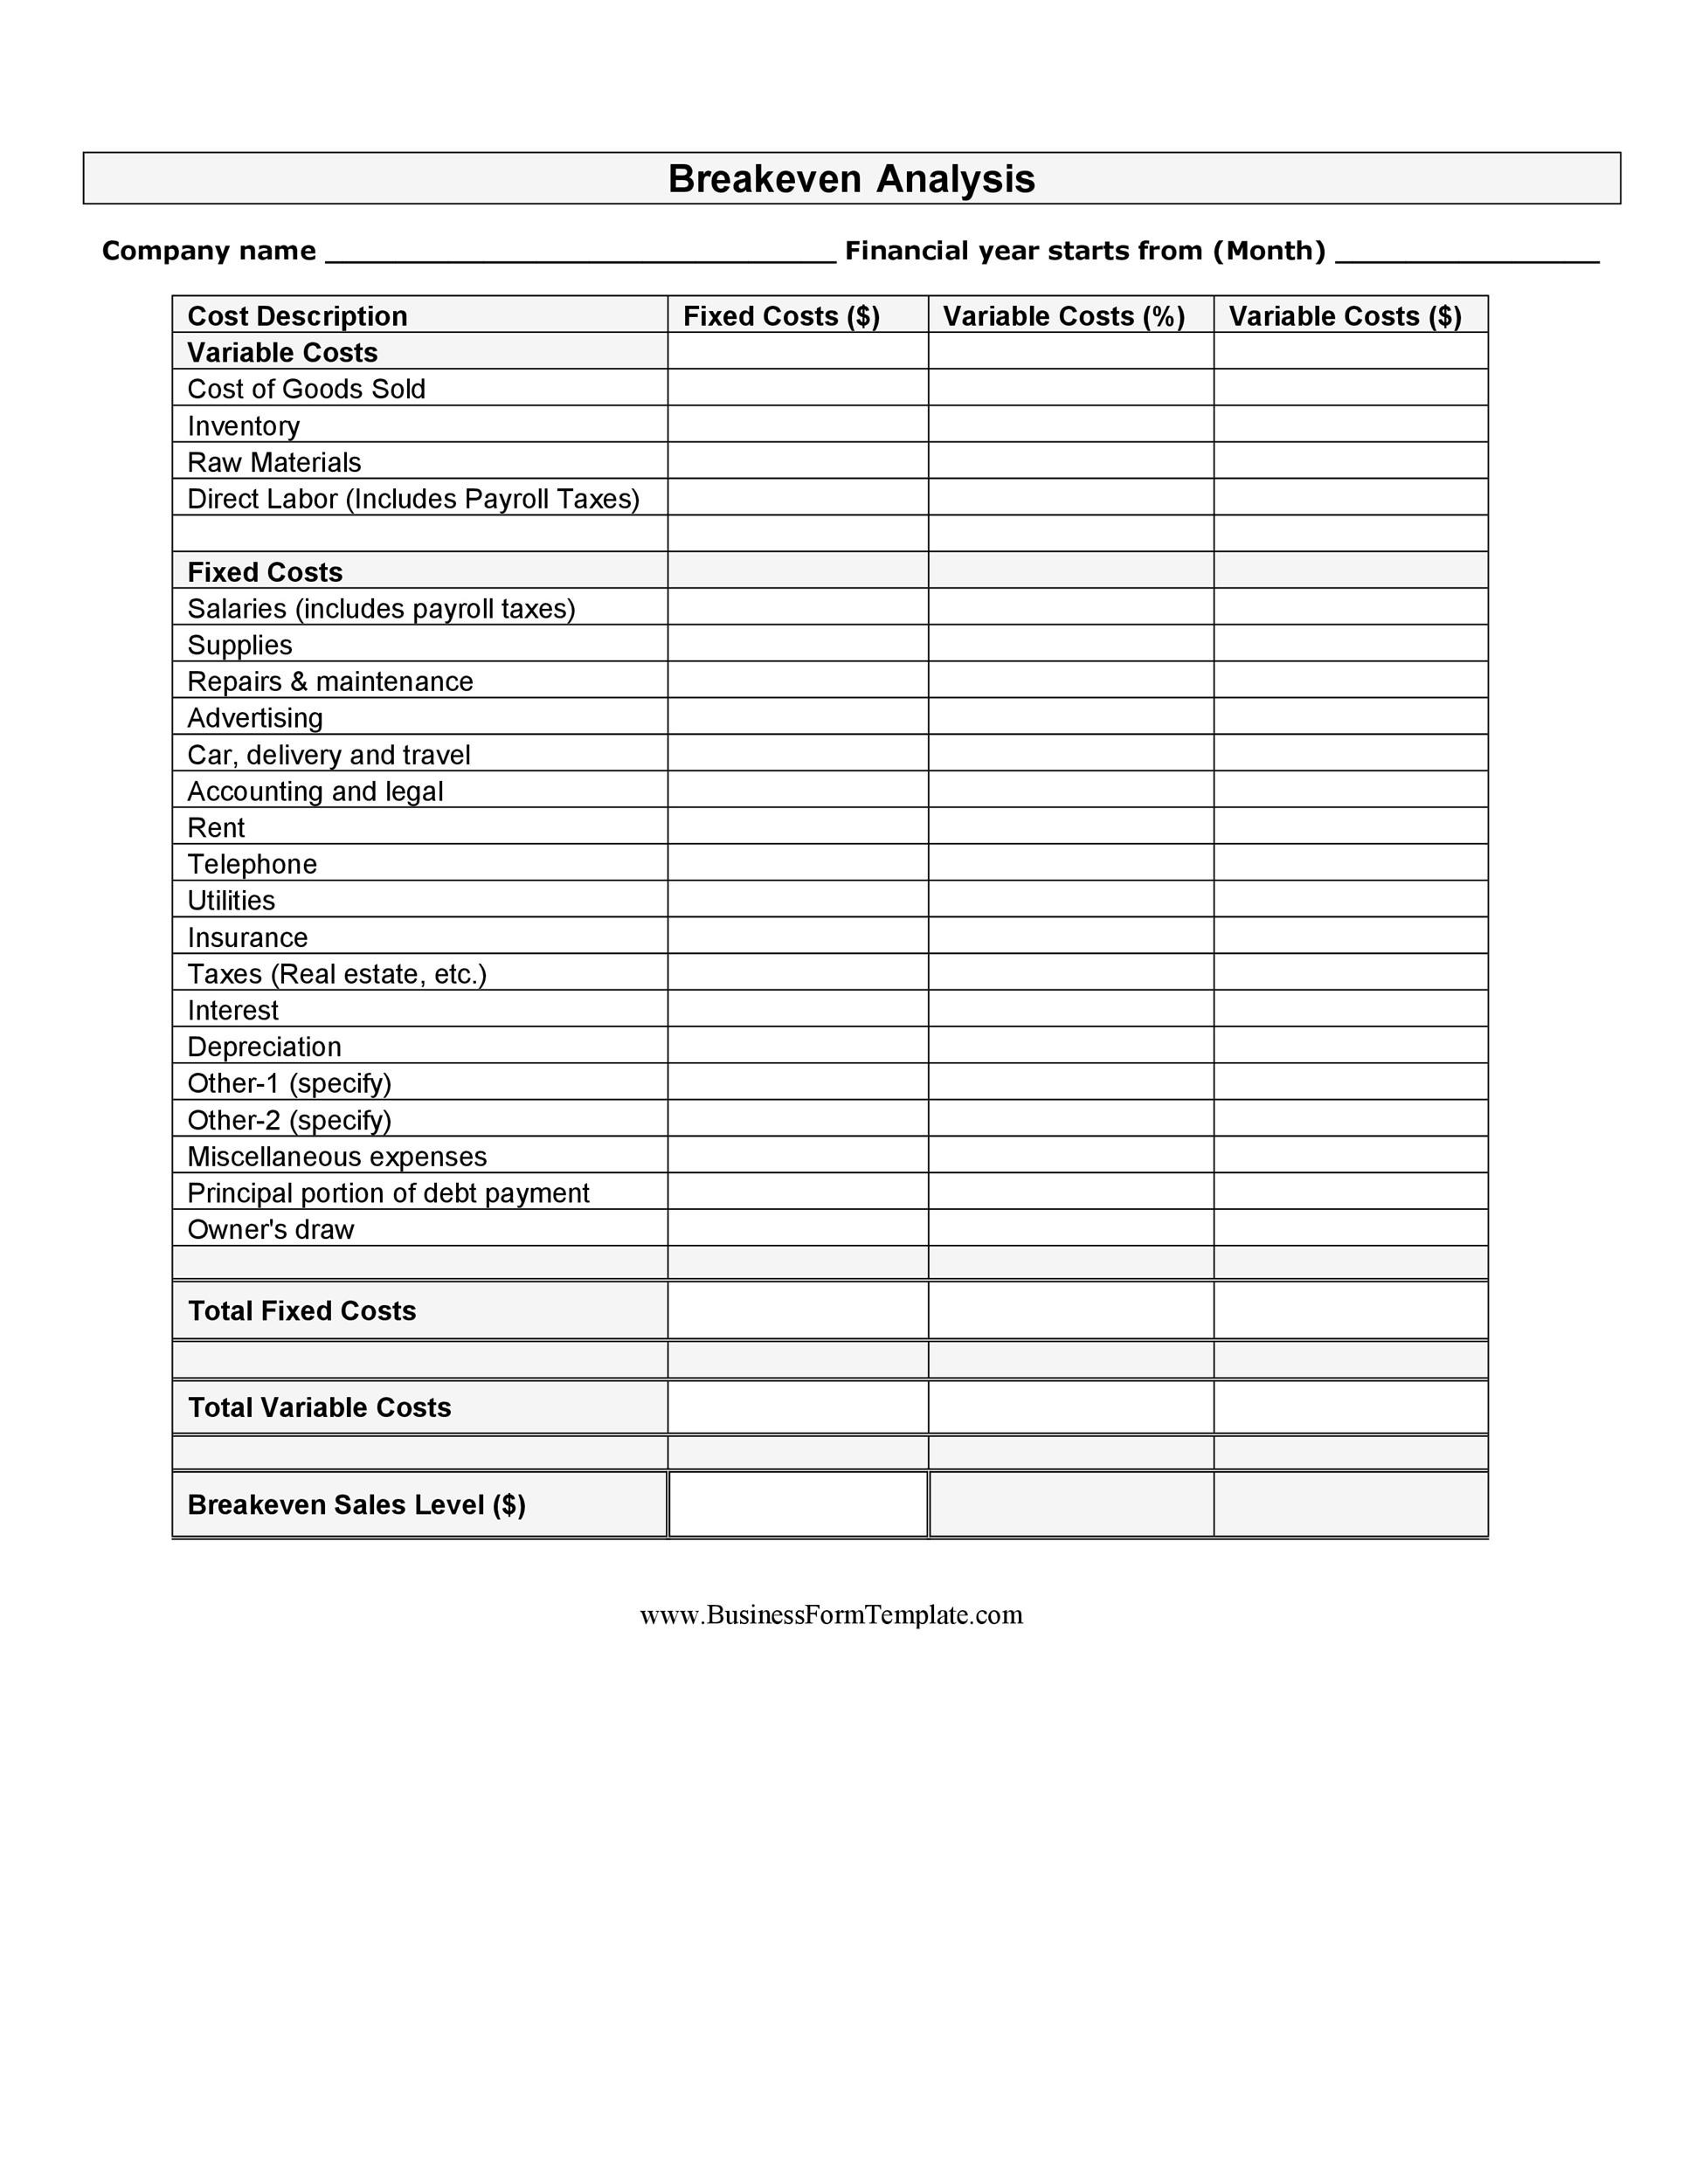
- Remember, fixed costs are those that remain constant. They stay the same regardless of the volume of your sales. They’re usually expressed in currency units.
On the other hand, variable costs are the ones which will change as your sales volume changes too. They’re usually expressed in percentages. - When you’re entering variable costs in your table, always use whole numbers. Do this instead of decimal numbers.
These are helpful tips and reminders for you to follow when filling up your template. When you’re entering the labels of your template, make sure they reflect your own business.
A break-even analysis is a tool which helps you see the “big picture.” So knowing how to fill up the report is very helpful.

